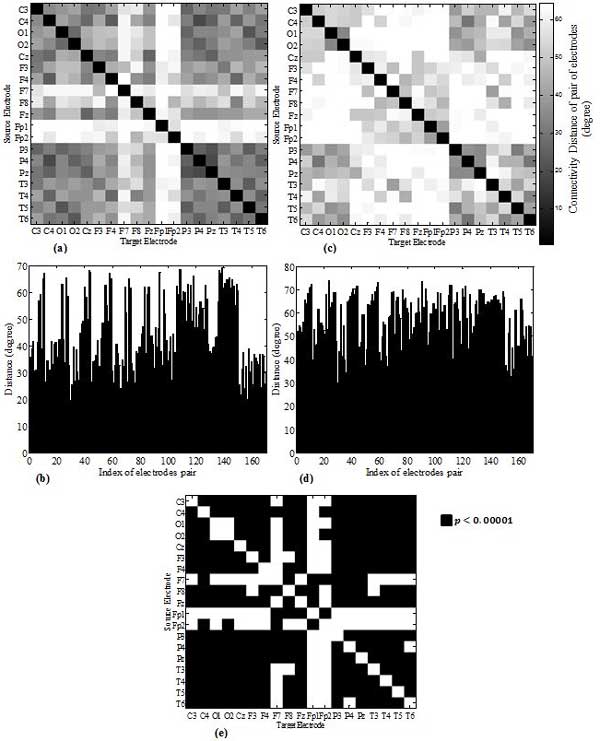
Figure 3.

Visualization of constructed functional connectivity networks. Visualization of constructed undirected functional connectivity networks (FCNs) and the corresponding plot of the connectivity distances for the average map across (a), (b) pediatric control group (c), (d) pediatric epilepsy. Index of electrodes pair represent the pair of electrodes, e.g. index 0 corresponds to the connectivity distance (angle) among pair c3-c4 and the index 1 corresponds to the connectivity distance (angle) among pair c3-o1 and etc. (e) shows the results of student t test for the null hypothesis that assumes no statistically significant differences for the index pair of electrodes across the pediatric epilepsy and pediatric control groups. Rejection of the null hypothesis is highlighted with the black boxes when p < 0.00001, bonferroni adjusted for multiple comparison.
