
Figure 5.
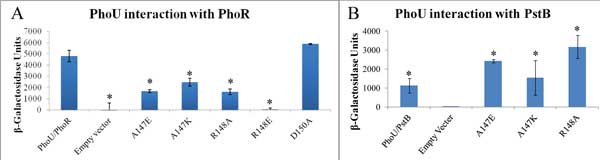
PhoU mutant interactions with PhoR and PstB. Values shown are the average of triplicate samples with the error bars representing standard deviation. A. BACTH analysis of PhoU/PhoR interaction. Various combinations of PhoU and mutants or an empty vector negative control were tested for interaction with PhoR. Activity of β-Galactosidase correlates with protein/protein interaction. * = p-value < 0.01 compared to PhoU/PhoR with a two-tailed T-test. B. This chart shows the interaction of PstB with various PhoU mutants and an empty vector negative control. * = p < 0.05 compared to Empty Vector with a two-tailed T-test.