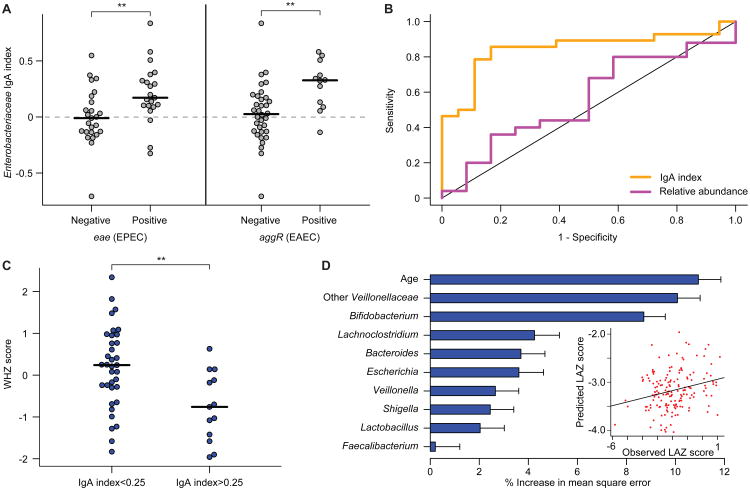
Fig. 5. Relationships among IgA indices, enteropathogen burden and nutritional status in 18 month-old Malawian children from the LCNI-5 cohort.
(A) IgA indices for Enterobacteriaceae were significantly higher in children that harbored EPEC and EAEC in their microbiota. Each circle represents results from an individual child. **, P<0.01 (Wilcoxon rank-sum test). (B) Receiving Operating Characteristic (ROC) curves for detection of EPEC (eae) and/or EAEC (aggR) using either Enterobacteriaceae relative abundance (purple, defined by V2-16S rRNA sequencing) or Enterobacteriaceae IgA index (orange). Samples were excluded where Enterobacteriaceae were not detected by 16S rRNA sequencing. The correlation to the presence of eae or aggR was significant for IgA index (P < 0.01; binomial logistic regression) but not relative abundance. (C) 18 month-old children from the LCNI-5 cohort with an IgA index value greater than 0.25 for Enterobacteriaceae had lower WHZ scores than did children with an index value less than 0.25. **, P<0.01 (unpaired Student's t-test). (D) Feature importance scores of bacterial taxa that are predictive of LAZ scores were generated by training a sparse Random Forests model using age and genus-level IgA index data from 134 fecal samples collected from the 11 kwashiorkor discordant twin pairs and the eight concordant healthy pairs enrolled in the Malawi Twin Study. To build the model, we included genus-level taxa (features) that had an IgA index value greater than 0.05 or less than -0.05 in 30% of all fecal samples (to remove genera that were only rarely seen and/or had very little enrichment in either the IgA+ or IgA- fractions). The IgA indices for the 25 taxa that satisfied this criterion were regressed against LAZ, and feature importance scores for each genus-level taxon were defined (mean±SD values shown). Shown are the nine genus-level taxa with mean importance scores greater than 1.5% that were incorporated into a 10 feature sparse model, which also included the chronological age of a child. The R2 value of 0.23 represents the goodness of fit of the model when applied to the twin training set, as defined using out-of-bag predictions. The plot in the inset shows that application of this model to 165 fecal samples collected from 6- and 18-month old singleton children in the LCNI-5 study predicted LAZ scores that correlated significantly with their actual LAZ measurements (Spearman's rho=0.2, P=0.009).

