
Figure 1. 2-D gel electrophoresis maps of secretomes from SKBR3 and BT474 cell lines are similar but distinct from 184A1 cell line.
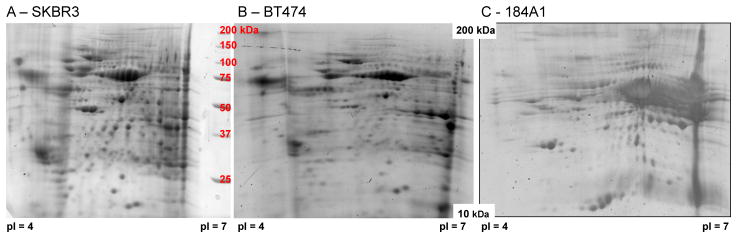
Representative results from concentrated media conditioned with SKBR3 (Panel A - 48 hour sample), BT474 (Panel B - 48 hour sample), and 184A1 (Panel C - 48 hour sample) cell lines. The horizontal axis corresponds to isoelectric focusing using a 7 cm IPG strip with pH range 4–7. The vertical axis corresponds to molecular weight separation using a 12% SDS-polyacrylamide gel with resolution between 10 to 250 kDa, as indicated by the molecular weight standard shown in panel A. Results representative of three biological replicates for SKBR3 and BT474 and two technical replicates for 184A1 cells (see Supplemental Figures S1-S3).