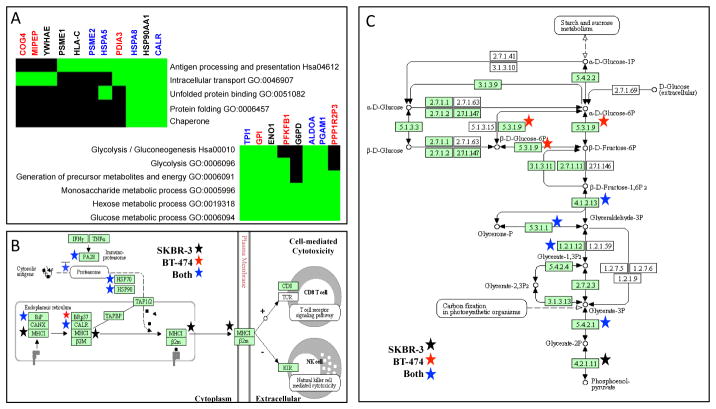
Figure 4. Pathway enrichment suggests that the exosomes derived from both BT474 and SKBR3 cells play similar functional roles in presenting antigens and modulating metabolism.
Functional annotation of the identified proteins using enrichment of biological pathways and gene ontology (GO) terms in DAVID (Panel A: TOP - antigen presentation cluster, BOTTOM - metabolism cluster). Green block indicated that a particular gene (columns) that is associated with a given pathway/GO term (rows) was identified in the secretome (BT-474 - red, SKBR3 - black, both cell lines - blue). Black regions of the grid indicate that GO association for a gene has not been reported. Graphical summaries of the MHC class I pathway (Panel B) and the glycolysis/gluconeogenesis pathway (Panel C) obtained from the KEGG Pathway database were annotated with the identified proteins (BT-474 secretome - red star, SKBR3 secretome - black star, secretomes from both cell lines - blue star).

