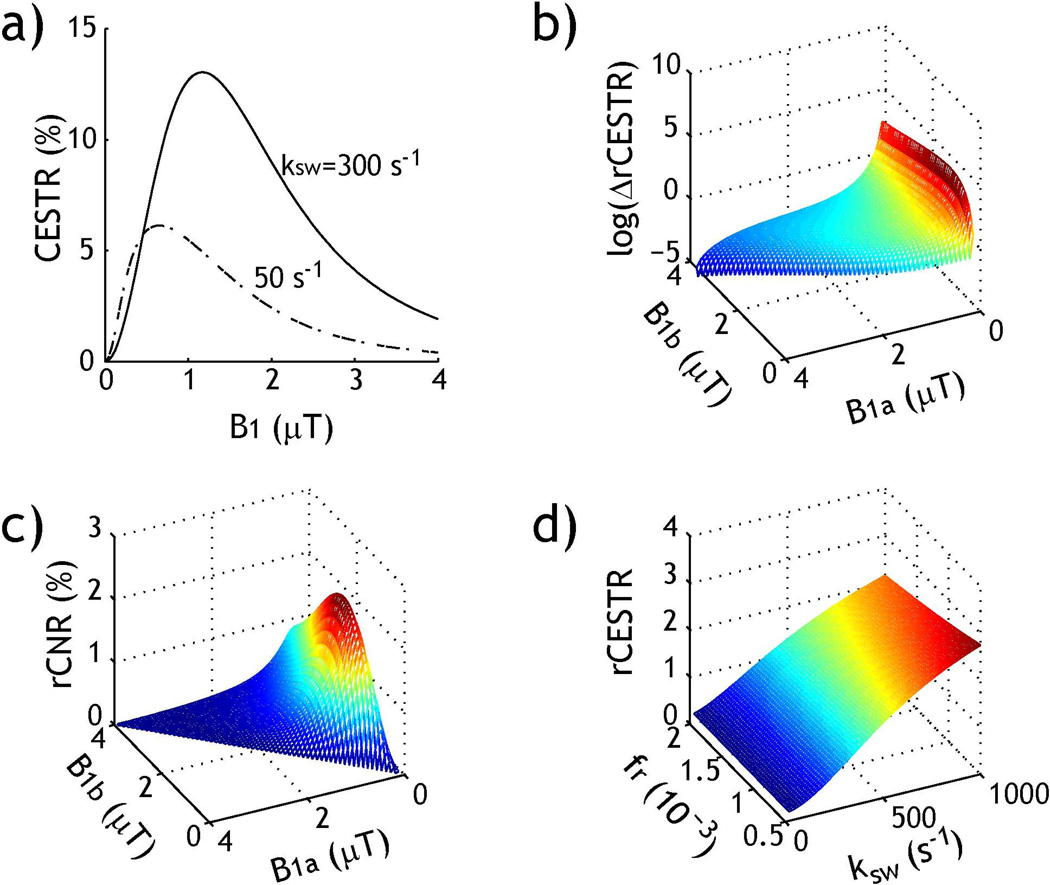
Fig. 1.
Simulation of RF power-based rCEST analysis. a) Routine asymmetry analysis (i.e., CESTR) as a function of B1 level for two representative exchange rates. b) Logarithm of rCESTR contrast (ΔrCESTR) as a function of B1 level. c) Relative contrast to noise ratio (rCNR) of rCESTR as a function of B1 level. d) Simulated rCESTR under typical B1 levels of 0.5 and 2 µT for representative labile proton ratio and exchange rate.

