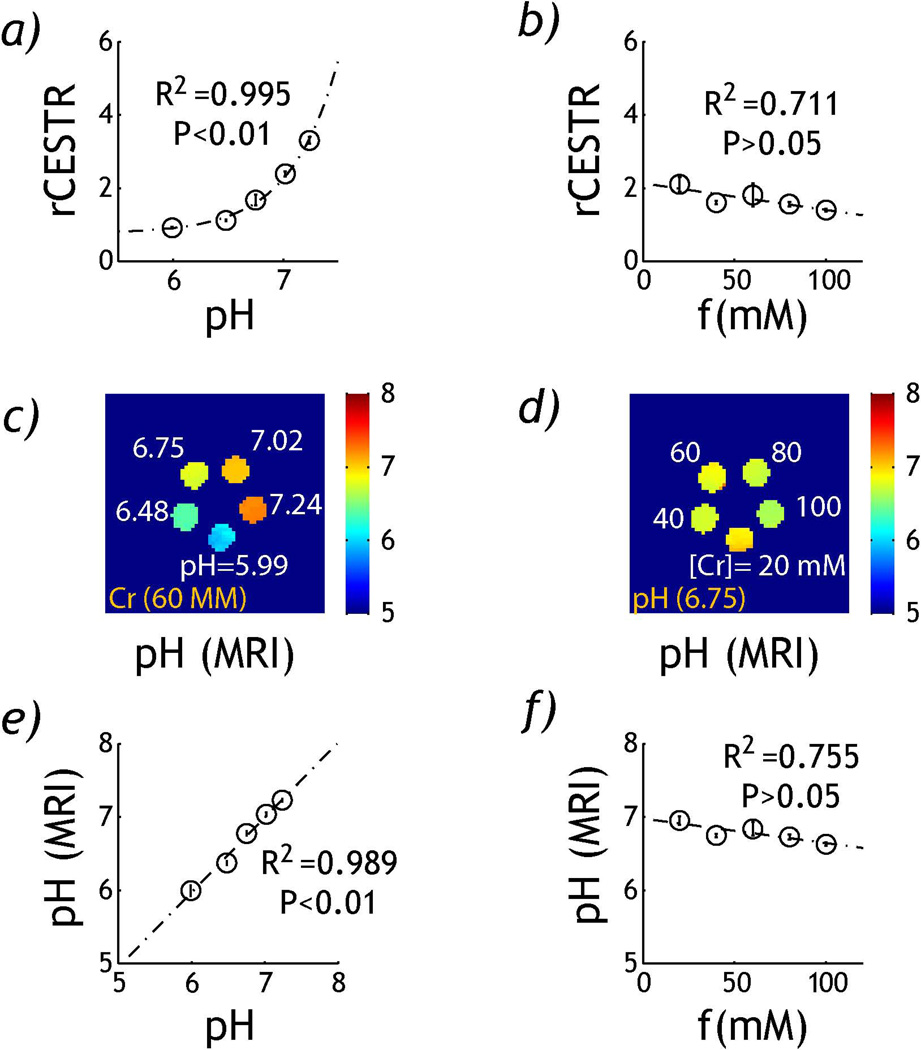
Fig. 4.
Comparison of rCESTR from pH and concentration phantoms. a) rCESTR as a function of pH. b) rCESTR as a function of creatine concentration. c) pH map determined from rCESTR map of the pH phantom. d) pH map determined from rCESTR map of the concentration phantom. e) Regression analysis between pH determined from rCEST MRI (pHMRI) with titrated pH for the pH phantom. f) Regression analysis between pHMRI with creatine concentration for the creatine concentration phantom.

