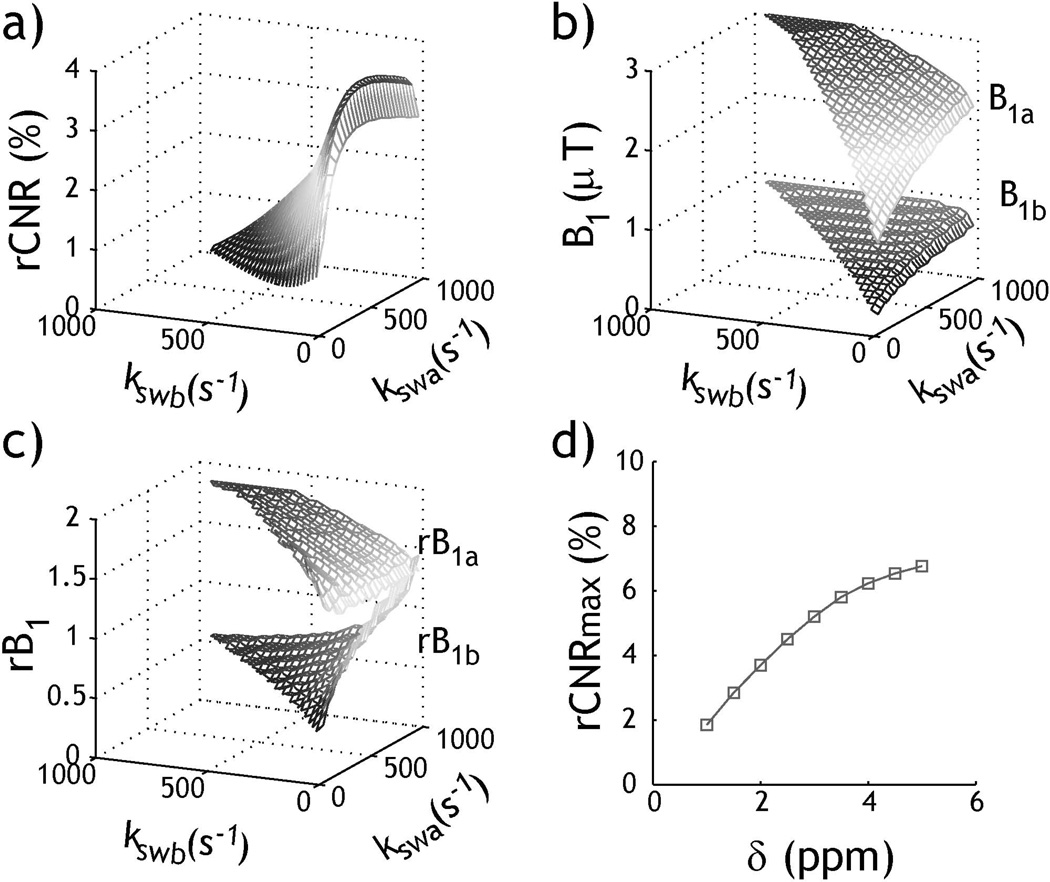
Fig. 7.
Optimization of rCESTR MRI. a) Numerically derived peak rCNR for exchange rates from 20 to 1000 s−1 (T1w/T2w=2s/100ms, δs=2 ppm at 4.7 Tesla). b) Simulated optimal B1 levels for peak rCNR. c) Optimal B1 levels for peak rCNR normalized by optimal B1 levels for each exchange rate independently. d) Peak rCNR as a function of chemical shift.

