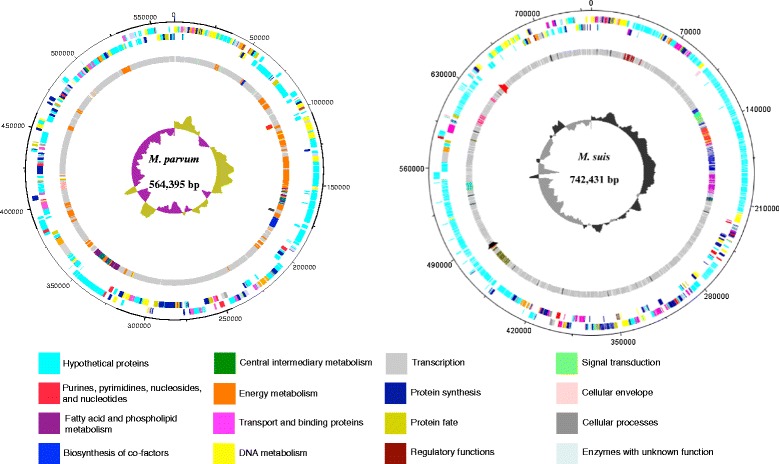
Figure 3.

Circular representation of the genomes of M. parvum strain Indiana and M. suis strain Illinois showing the organization of the coding sequences (CDS). The dnaA gene is at position zero in both genome plots. Outer to inner circles: circle 1: predicted CDS on the positive strand; circle 2: predicted CDS on the negative strand. Each CDS is classified by TIGR role category according to the color designation in the legend below the plots; circle 3: CDS in the largest paralogous gene families with each family represented by a different color in each genome, non-paralogous CDS are light grey. Paralogous families of M. parvum with less than 5 CDS are represented in orange. Black and red marks represent the 16S rRNA gene and the 23S/5S rRNA gene operon, respectively. Circle 4: GC skew. The diagrams were generated using Artemis 12.0 - DNAPlotter version 1.4, Sanger Institute. (M. suis plot was extracted from Guimaraes AM, Santos AP, SanMiguel P, Walter T, Timenetsky J, Messick JB: Complete genome sequence of Mycoplasma suis and insights into its biology and adaption to an erythrocyte niche. PLoS One 2011, 6:e19574 [1], with permission from the copyright holder).
