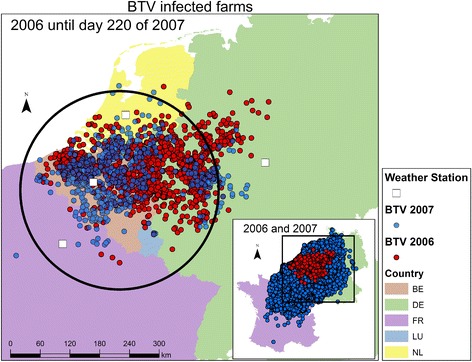
Figure 1.

Map of the 2006 BTV-8 outbreak (Red) and the 2007 outbreak (Blue). There is a large overlap of the areas containing the cases of the 2006 epidemic (red points) and the cases in the first period (220 days) of the 2007 epidemic (blue points). The black circle is the model approximation of the infected 2006 area. The white squares indicate the locations of the weather stations, from which the temperature data during the epidemic was obtained. In the overview map the spatial distribution of the 2006 (red) and 2007 (blue) outbreak are provided. The 2007 outbreak covers a much larger area than the 2006 outbreak.
