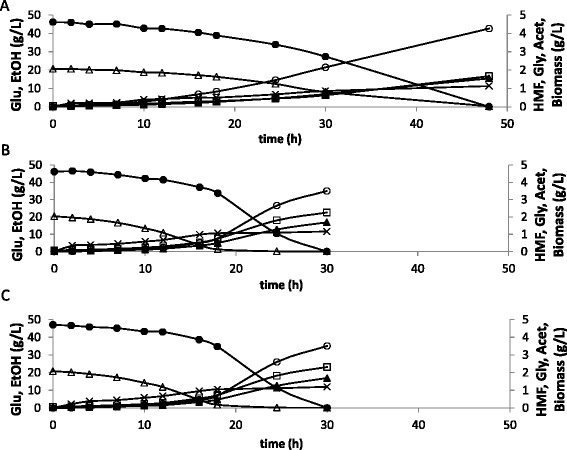
Figure 3.

Comparison of glucose/HMF consumption and acetate/glycerol/ethanol/biomass formation during anaerobic cultivations in the presence of HMF for the control strain (A) and strains CEN.PK 113 5D [mutAdh1p] (B) and CEN.PK 113 5D [natAdh1p-mut110, 295] (C). Legend: ●-glucose, ○-glycerol, X-acetate, ▲-ethanol, ∆-HMF, □-biomass. The experiment was performed in biological duplicates and the figure shows the data of one representative profile for each strain. The standard deviation between replicates was less than 15%.
