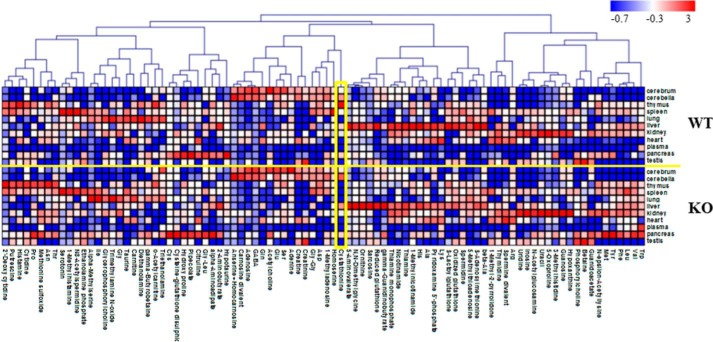
FIGURE 1.
Heat map showing relative metabolite concentrations. In total, 153 metabolites were identified and quantified by metabolomics analysis. Of these, 90 metabolites detected in multiple samples (≥3) from WT or KO mice as well as multiple tissues (≥3) were used here. Each metabolite concentration was transferred to a Z-score and assigned the corresponding color. Pearson correlation was used for clustering. MeV TM4 (47) was used for the analysis and the visualization. The concentrations of cystathionine (indicated with a yellow box) are also given in Table 1.

