
FIGURE 6.
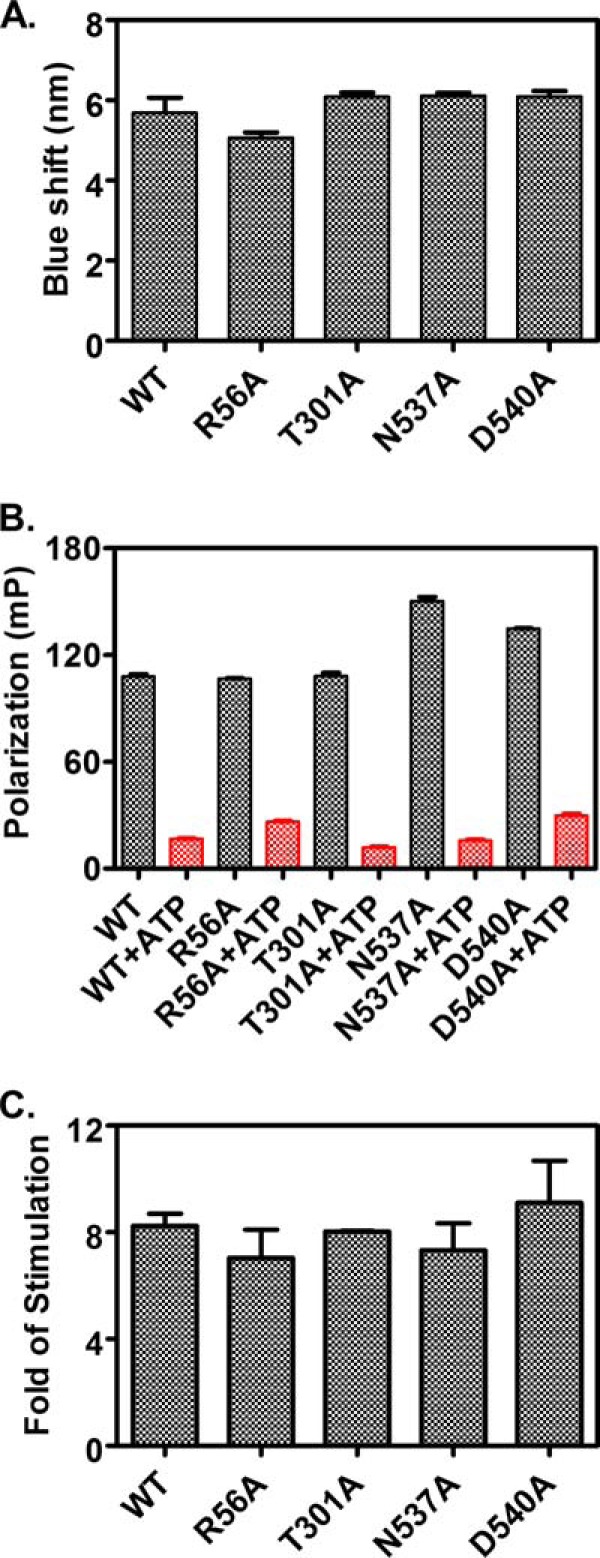
Tests of the ATP-induced allosteric coupling in the dimer mutant proteins. A, ATP-induced tryptophan fluorescence shift. The blue shift for each protein was calculated as the wavelength difference of the maximal emission between the samples incubated with ATP and ADP. B, ATP-induced bound peptide substrate release. F-NR was incubated with 5 μm each of DnaK protein for more than 3 h to allow binding to reach equilibrium. Fluorescence anisotropy was measured for binding in the absence of ATP (black bars). Then ATP was added to a final concentration of 2 mm and incubated for 2 min. The resulting anisotropy measurements represent the binding in the presence of ATP (red bars). C, NR peptide stimulation of the intrinsic ATPase activity of DnaK. Fold of stimulation in the presence of 40 μm NR peptide was calculated by setting the intrinsic ATPase activity rate (kcat) as 1.