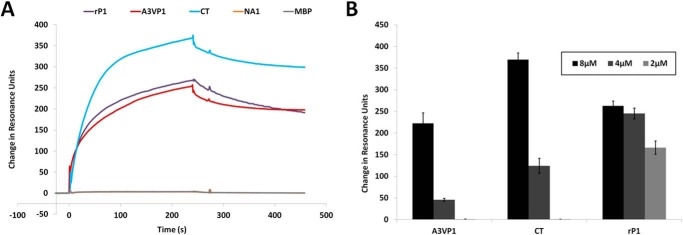
FIGURE 4.

Intermolecular interactions between P1 fragments. A, Biacore surface plasmon resonance sensorgrams demonstrating the binding of each indicated polypeptide (8 μm) to immobilized A3VP1. The P1 NA1 fragment and MBP were used as negative controls. B, bar graph showing the maximum ΔRU of Biacore experiments illustrating the concentration dependence of binding of each of the recombinant P1 fragments (tested at 8, 4, and 2 μm) to immobilized A3VP1. Bars represent the average ± S.E. (error bars) of three separate experiments.
