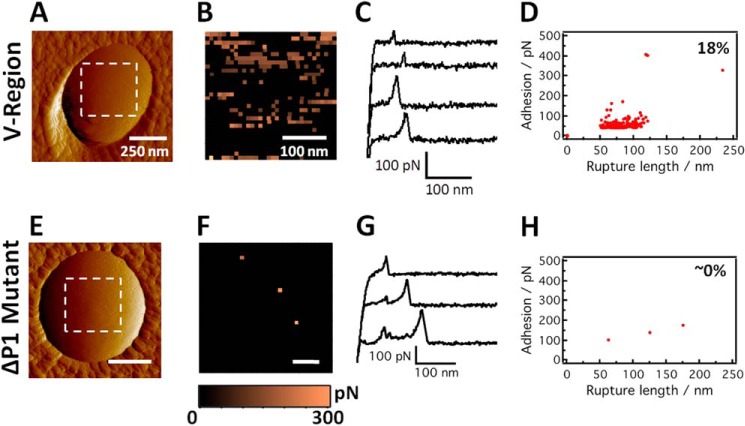
FIGURE 9.
Molecular mapping of the apical head of P1 proteins on live S. mutans cells. A and E, deflection images recorded in PBS buffer with a bare silicon nitride tip on the polar region of wild-type and ΔP1 mutant cells, respectively. V, variable. B and F, adhesion force maps recorded on the poles of wild-type and mutant cells (in the dashed square regions shown in A and E) using tips functionalized with anti-P1 antibodies targeting the apical head (mAb 1-6F). C and G, typical retraction force curves acquired in PBS buffer between anti-P1 tips and the poles of wild-type and ΔP1 mutant cells. D and H, scatter plot of adhesion versus rupture length for the adhesion events recorded on the poles of wild-type (force map in B) and ΔP1 mutant (force map in F) cells. The reported percentage values were from a total of n = 1024 force curves. Similar data were obtained in independent experiments using four tips and eight cells for wild-type cells and three tips and five cells for ΔP1 mutant cells.

