
FIGURE 3.
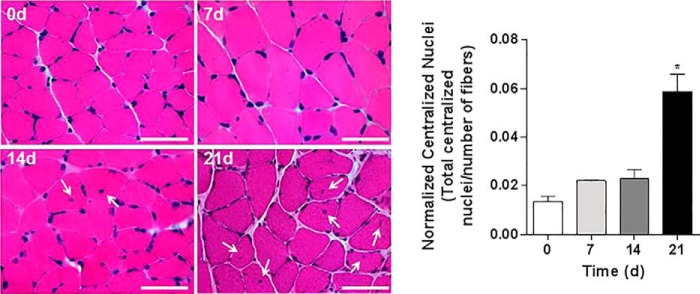
High CO2 exposure causes a time-dependent increase in nuclear centralization in myofibers. Histological analysis of myofibers from soleus muscle sections with H&E staining from mice exposed to room air or 10% CO2 levels for 7, 14, and 21 days. The graph represents the number of centralized nuclei normalized by the number of fibers. Scale bars, 100 μm. n = 3. Arrows indicate centralized nuclei. Representative images were taken at 60×. *, p < 0.05.