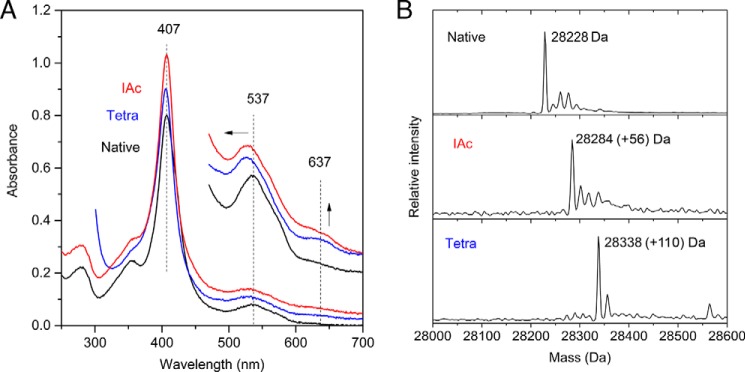
FIGURE 1.

Modification of Cys123 by electrophiles at pH 8. A, UV-visible spectra of 4 μm (main spectra) or 20 μm (high wavelength inset) TsdA in 30 mm Tris-HCl, pH 8.0, 160 mm NaCl. Samples were either untreated (Native), incubated for 1 h with 50 mm sodium tetrathionate (Tetra), or incubated for 1 h with 20 mm sodium iodoacetate followed by desalting by size exclusion chromatography (IAc). Spectra are presented offset in the y axis direction for clarity. Arrows indicate the movement or intensity change of the highlighted peaks. B, ESI-MS analysis of the samples from A. The expected mass increases for thiosulfonation and for carboxymethylation are 112 and 57 Da, respectively.
