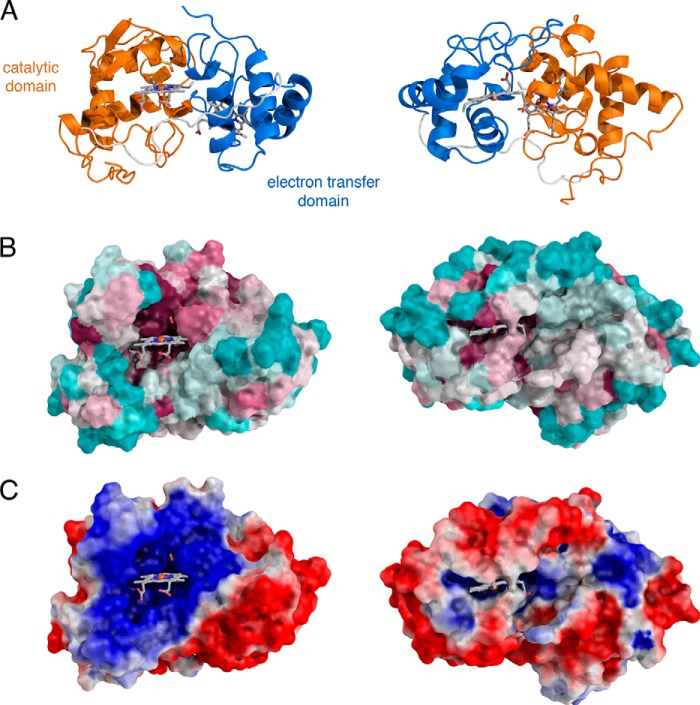
FIGURE 6.
Accessibility and environment of the TsdA hemes. The views in each column are in the same orientation. The left-hand panels show the entrance to the catalytic site, and the right-hand panels show the environment around the electron acceptor site. The hemes and bound thiosulfate are shown in stick representation using the same color scheme as Fig. 4. A, schematic representation of the protein backbone. B, surface conservation calculated using Consurf (40) from 150 sequences verified as TsdA proteins by homology across the full polypeptide length, including the conservation of the two type c heme motifs, the heme axial ligand residues, and Arg119. Cyan, regions of lowest conservation; magenta, regions of highest conservation. C, the surface potential of TsdA calculated using APBS (41) colored from positive (blue) to negative (red). Note that the calculations do not include the heme molecules.

