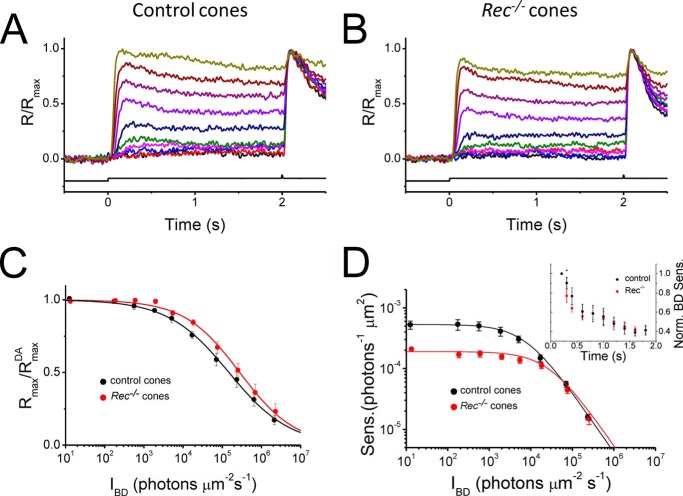
FIGURE 4.
Effect of background light on cone operating range in control and Rec−/− retinas. A and B, maximal M-cone response amplitudes under a series of background lights were measured by a white test flash 2 s after the onset of 500-nm background light in control (A) and Rec−/− (B) retinas. The time course of light stimulation is shown on the bottom of each panel. The step light intensities (500-nm photons μm−2 s−1) were 13, 170, 560, 1.9 × 10³, 5.1 × 10³, 1.7 × 10⁴, 7.0 × 10⁴, 2.3 × 10⁵, 6.4 × 10⁵, and 2.1 × 10⁶. C, normalized maximal M-cone responses as a function of background intensity, IBD, for control (black circles) and Rec−/− (red circles) retinas. D, averaged flash sensitivity (SF) as a function of background intensity for control (black circles) and Rec−/− (red circles) M-cones. Solid curves are best fitting Weber-Fechner functions with IS of 10,000 (control) and 29,000 (Rec−/−) photons μm−2 s−1. Inset, sensitivity change in background light in control (black, n = 6) and Rec−/− (red, n = 6) cones. Step light sensitivity, 1/IR (from Equation 2), was normalized to its peak value, as a function of time after onset of the background light. * indicates p < 0.05. Error bars show S.E. Sens., sensitivity; Norm., normalized.

