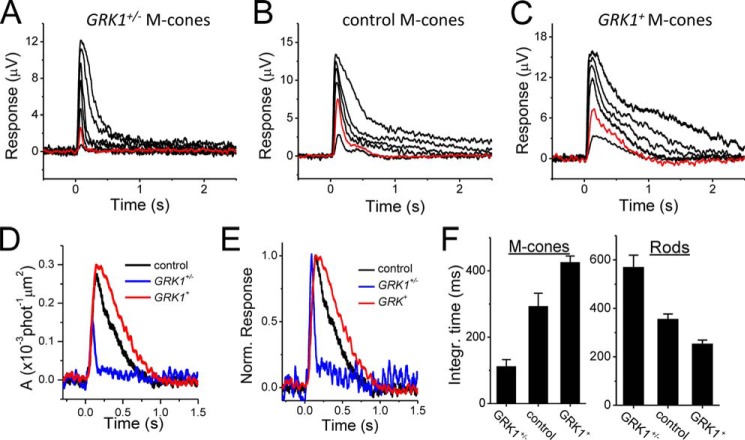
FIGURE 6.
A–C, flash response families of GRK1+/− (A), control (B), and GRK1+ (C) M-cones from transretinal recordings. Flash intensities (500-nm photons μm−2) in each panel are 630, 2300, 7400, 2.1 × 10³, 5.3 × 10³, and 1.9 × 10⁵. Red traces in each panel correspond to responses evoked by identical intensity of 500-nm light. D and E, estimated single-photon responses (D) and normalized dim flash response (E) of GRK1+/− (blue), control (black), and GRK1+ (red) M-cones. F, averaged dim flash response integration time for M-cones (left) and rods (right) of GRK1+/− (n = 8), control (n = 9), and GRK1+ (n = 6) mice. For comparison, rod data in Fig. 2F are reproduced from Ref. 20. Error bars show S.E. Integr., integration; Norm., normalized; phot, photons.

