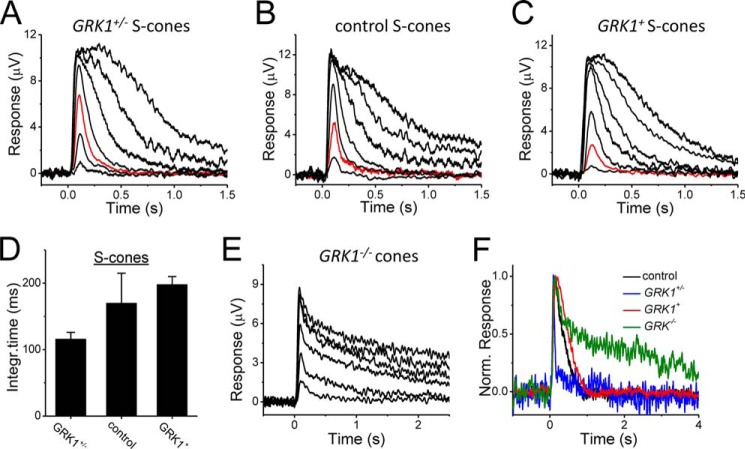
FIGURE 7.
A–C, flash response families obtained from ventral retina of GRK1+/− (A), control (B), and GRK1+ (C) S-cones from transretinal recordings. Red traces in each panel indicate responses evoked by identical intensity of UV light. D, averaged dim flash response integration time for S-cones of GRK1+/− (n = 11), control (n = 7), and GRK1+ (n = 5) mice. E, cone flash response family from dorsal GRK−/− retina stimulated with 500-nm light. F, normalized dim flash responses of control (black), GRK1+/− (blue), GRK1+ (red) (all reproduced from Fig. 6), and GRK1−/− (green) M-cones. Error bars show S.E. Integr., integration; Norm., normalized.

