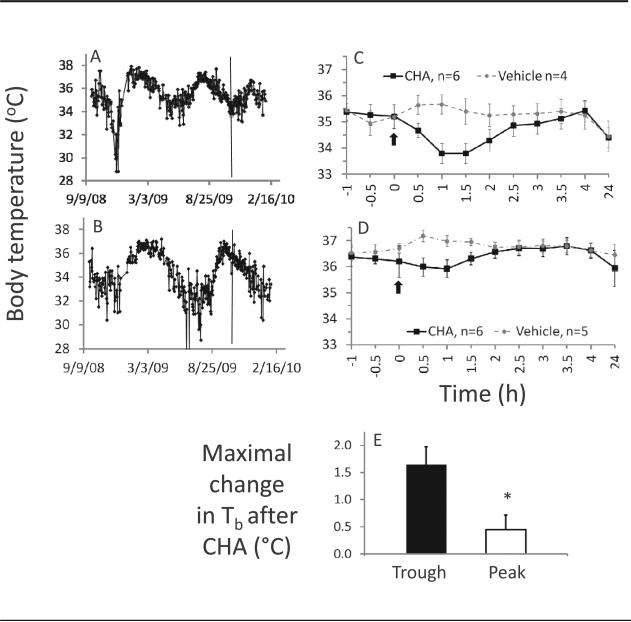
Figure 3.
The drug-induced change in Tb depends on the position of AGS in their circannual Tb cycle. Timing of drug administration indicated by vertical lines was identified as a trough (A) or a peak (B). C and D show CHA (0.1 mg/kg)–induced effects on Tb for AGS tested in a Tb trough (C) or a peak (D); arrows indicate time of drug administration. The drug-induced change in Tb was greater in animals tested during a trough than in animals tested during a peak (E). Data shown are mean ± SEM. *p < 0.05, n indicates the number of tests in a Tb peak or in a Tb trough.

