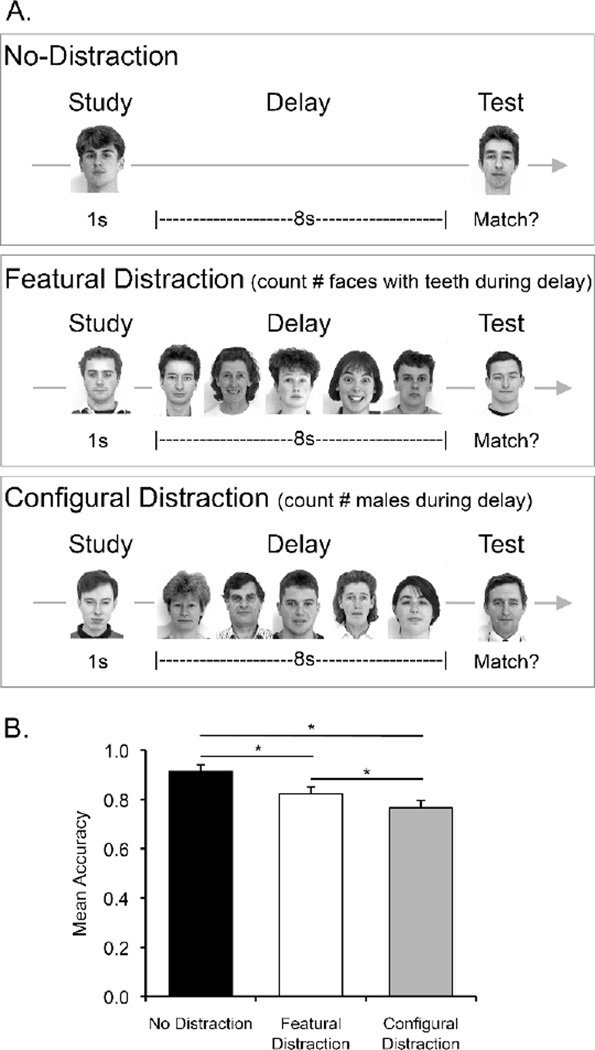
Figure 4.
(A) Experiment 3 task design. (B) Results from Experiment 3. Mean accuracy (hits – false alarms) for healthy controls on a 8s delayed face matching-to-sample task with no-distraction (black bar), featural distraction (white bar), and configural distraction (grey bar). Error bars represent within-subject standard error. * p < .05 (1-tailed).

