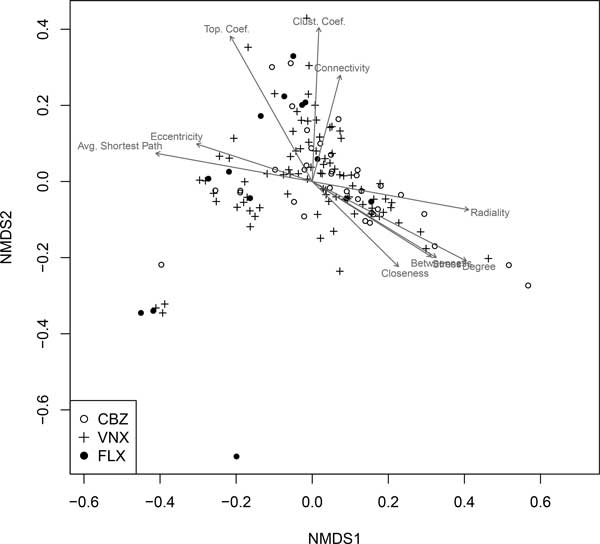
Figure 3.

Non-metric multidimensional scaling (NMDS) representation of significantly enhanced gene sets in fish brains. This figure compares network characteristics of gene sets enhanced by pharmaceuticals in multivariate network space. Arrows within the scatterplot indicate the direction of most rapid increase for an indicated variable. Arrow length is scaled by the R2 value of a multiple regression model in which the variable in question is the response and the NMDS axis scores are explanatory variables.
