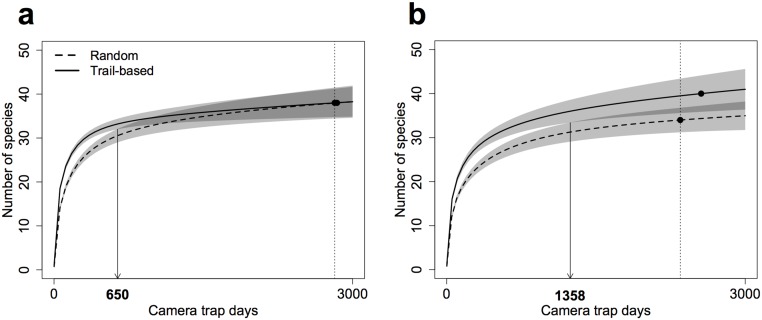
Fig 2. Sample-based species accumulation curves describing the medium to large mammal community richness in the study area during the (a) dry and (b) wet season.
Shaded polygons denote the 95% confidence intervals drawn from 200 randomisations performed with replacement and based on the unconditional variance. Confidence interval overlap is shown in a darker shade of grey. For each season, curves were compared at sampling efforts symbolised by the dotted vertical lines. Downward pointing arrows and bold numbers on the x-axis mark the level of effort at which the richness of observed communities could not be considered as significantly different.

