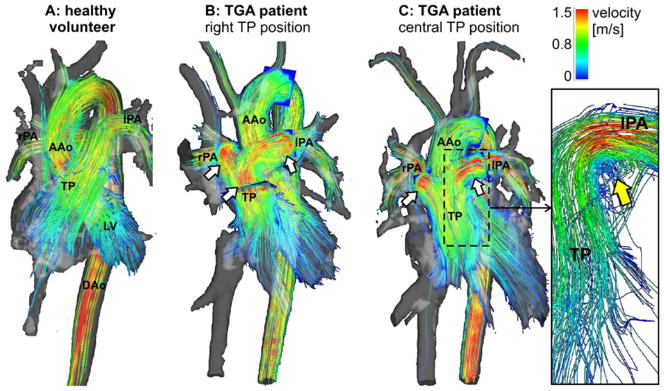
Fig. 2.

Overview of 3D haemodynamics in healthy volunteers (a) compared with TGA patients visualised by colour-coded streamlines. High systolic flow velocity in the pulmonary trunk (TP) and pulmonary arteries are visible in both patients (b, c). c Vortical flow at the transition of the TP to the left pulmonary artery (lPA) in a TGA patient with straight anterior TP position. LV left ventricle, AAo ascending aorta, DAo descending aorta
