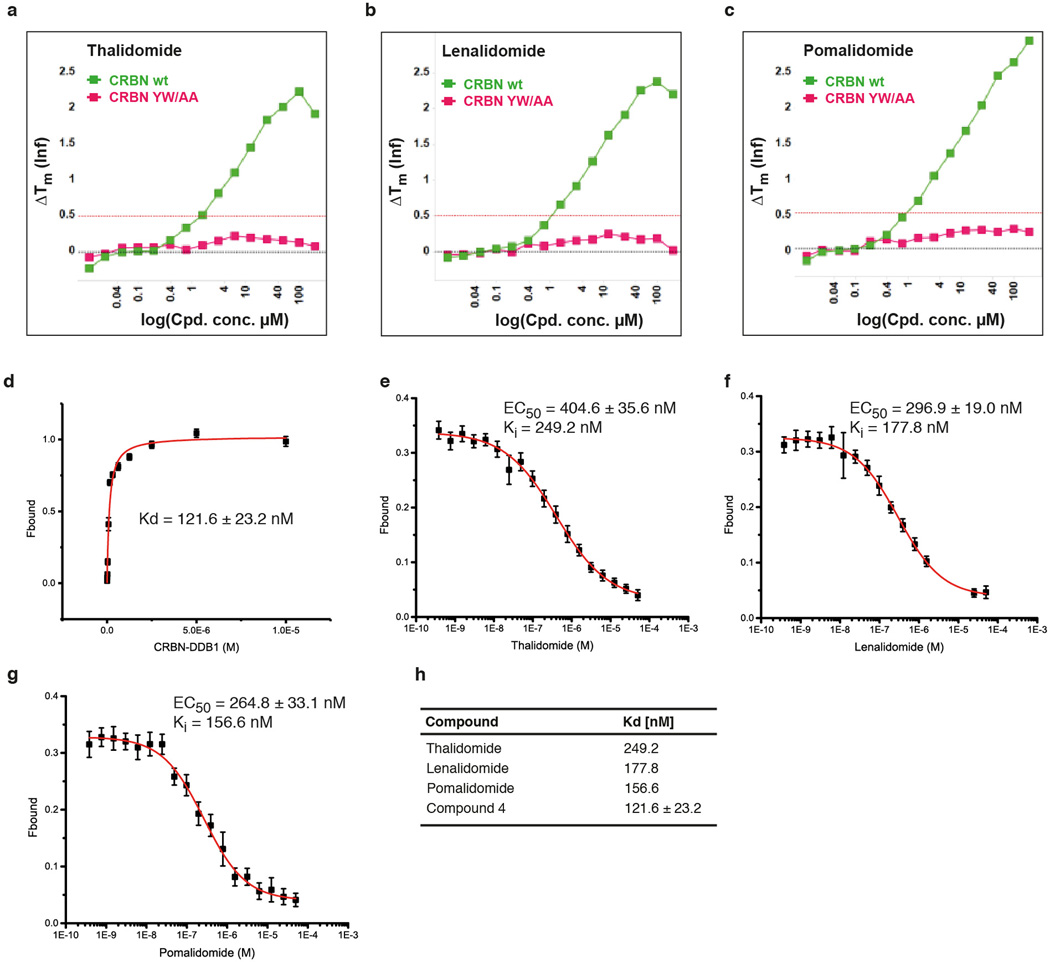
Extended Data Figure 4. Detailed analysis of CRBN-compound interactions.
(a) Thermal denaturation assays of thalidomide binding to hsDDB1-hsCRBN wild type (CRBN wt) and to an hsDDB1-hsCRBN mutant harbouring mutations Tyr386Ala and Trp388Ala (CRBNYW/AA). While the mutant showed no sign of binding to thalidomide, wild type CRBN caused a shift in the thermal denaturation curve indicative of compound binding. (b) As in (a), but using lenalidomide or (c) pomalidomide. (d) Increasing amounts of hsDDB1-hsCRBN were mixed with 20 nM Cy5-coupled thalidomide (compound 5). Protein-compound interactions were quantified using fluorescence polarisation of the Cy5 dye. Curve fitting to a model assuming one binding site resulted in a KD of 121.6 ± 23.2 nM. Data shown are the means ± SD (n=3).(e) Competitive titration of thalidomide to hsDDB1-hsCRBN (50 nM) and Cy5-thalidomide (20 nM); EC50 values were used to calculate a Ki50 (equivalent to the KD of thalidomide to hsDDB1-hsCRBN) of 249.20 nM. Similar titrations were carried out for (f) lenalidomide and (g) pomalidomide resulting in Ki values of 177.80 nM and 156.60 nM, respectively. For all competitive titrations (e–g) data shown are the means ± SD (n=3).(h) Affinities of thalidomide analogues for the CRBN receptor.

