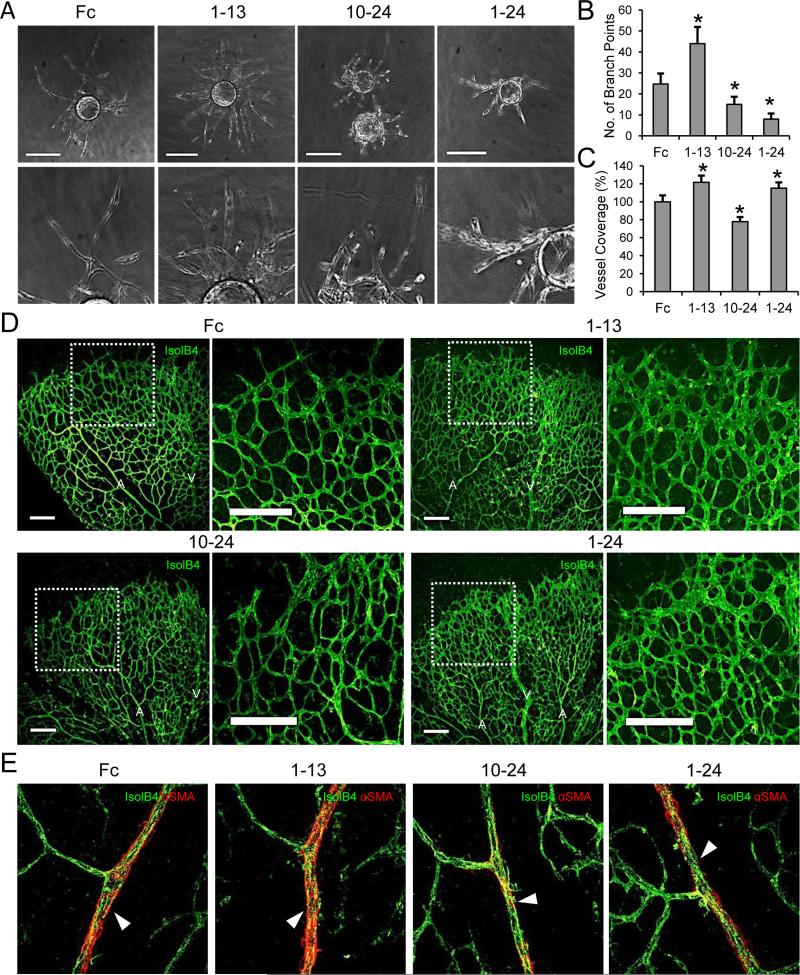
Figure 3. N1 decoys variants function distinctly in vitro and in retinal angiogenesis.
(A) N1 decoy assessment in the HUVEC fibrin bead sprouting assay at day 7. Scale bars: 200 μm. (B) Quantification of the mean number of branch points per bead ± S.D. * P value < 0.05. Fibrin bead sprouting assays were performed in triplicate and repeated twice. (C) Quantification of the mean percent vascular density of the P5 retinas ± S.D. * P value < 0.05. (D) Isolectin B4 (IsolB4) staining of P5 retinas. A: artery, V: vein. (E) Isolectin B4 (IsolB4) and αSMA staining of P5 retinas. Vascular smooth muscle cell covered retinal arteries noted with arrowhead (n = 6).

