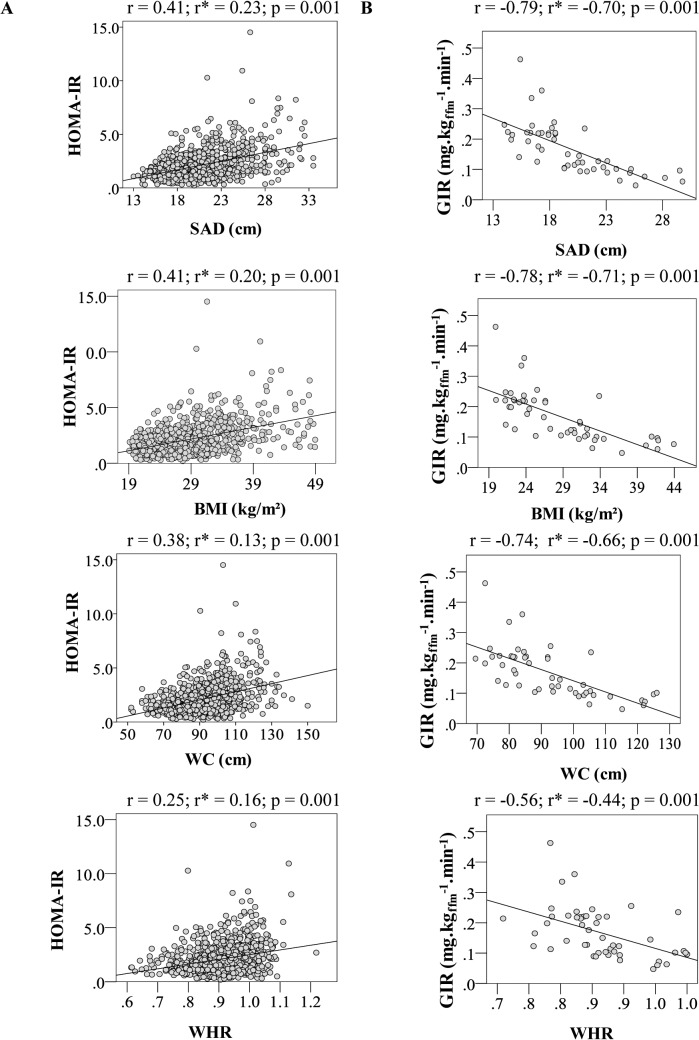
Fig 1. Correlation coefficients non adjusted and adjusted for age and total body fat mass between anthropometric parameters and HOMA-R index (A) and insulin sensitivity index obtained in the hyperglycemic clamp test (B).
A: total sample n = 824; B: subsample n = 50. *Adjusted for age and total body fat.

