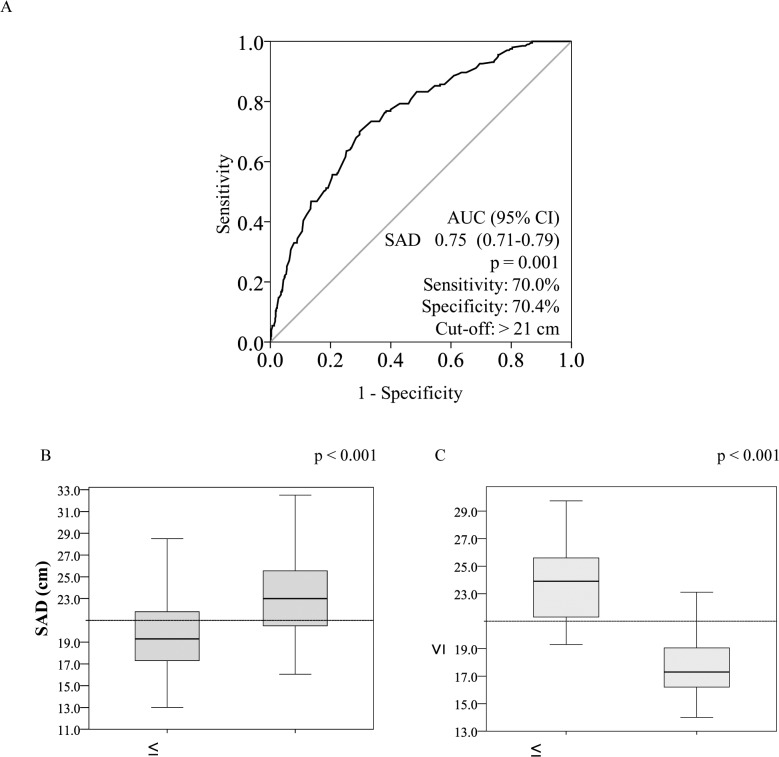
Fig 2. ROC curve for sagittal abdominal diameter for identifying the optimal cutoffs for insulin resistance according to the HOMA-IR index (A) and box plots with the distribution of the sagittal abdominal diameter according to the diagnostic of insulin resistance by the HOMA-IR index (B) and the hyperglycemic clamp test (C).
The Mann-Whitney test was applied for SAD.

