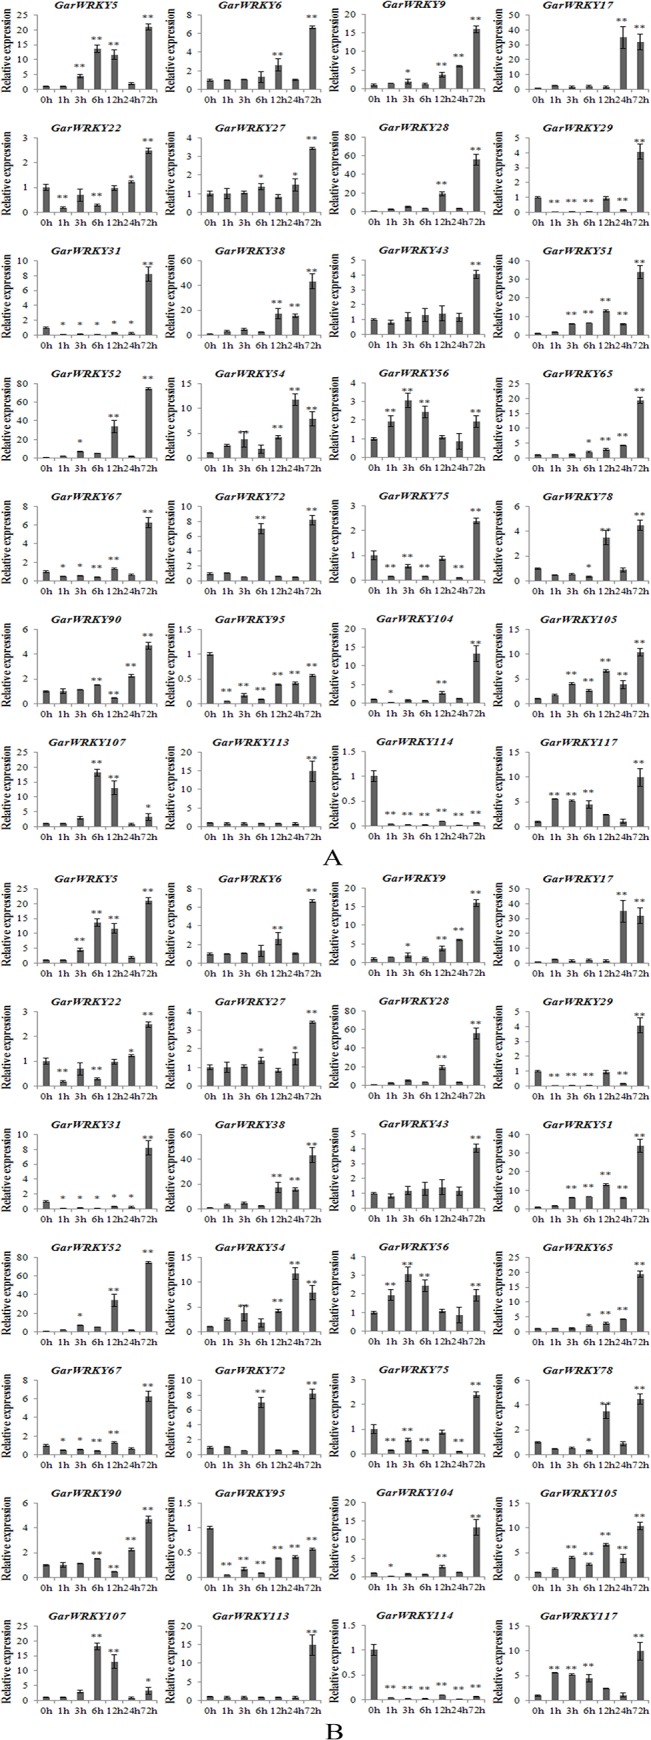
Fig 4. Expression profiles of GarWRKY genes under NaCl stress.

A: roots; B: leaves. The cotton actin gene was used as an internal reference. The data are mean ± SE of three biological replicates. * and ** indicate statistical significance at the 0.05 and 0.01 probability level, respectively.
