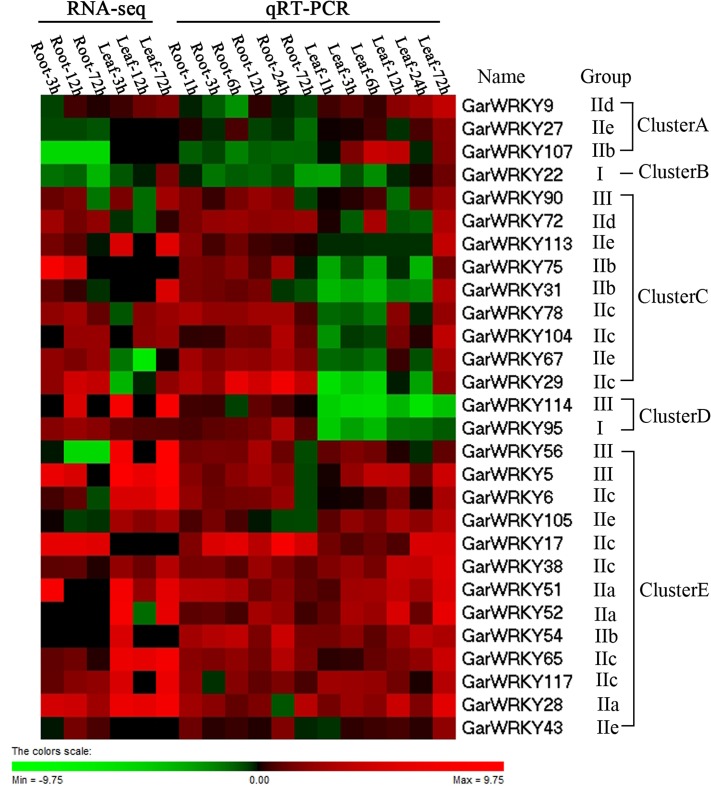
Fig 5. Heat map of the expression patterns of 28 salt-responsive GarWRKYs from RNA-Seq and qRT-PCR data.
Changes in expression levels are displayed from green (downregulated) to red (upregulated), as shown in the color gradient at the bottom right corner (color figure online). Heat maps were generated and hierarchical clustering was performed using Cluster 3.0 based on log2 fold-change data in response to NaCl stress. The normalized expression values from RNA-Seq data were provided in S4 Table.

