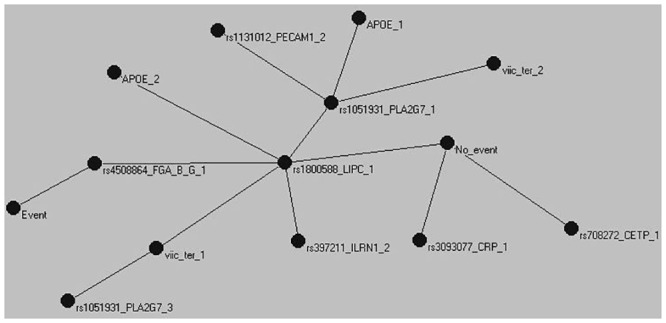
Fig 2. Meta-MST graph showing the connections represented in at least 9 of the 10 MSTs constructed after randomly excluding 10% of the records.

In contrast to statistical testing, where small sample sizes lead to loss of statistical power for the identification of associations, the method used here is affected in terms of the stability of the proposed solution. Despite the smaller Meta-MST graph compared to the full MST, the main core of the graph with the two event nodes at opposite sides of the LIPC gene and fibrinogen locus nodes and most variables between them remains unchanged.
