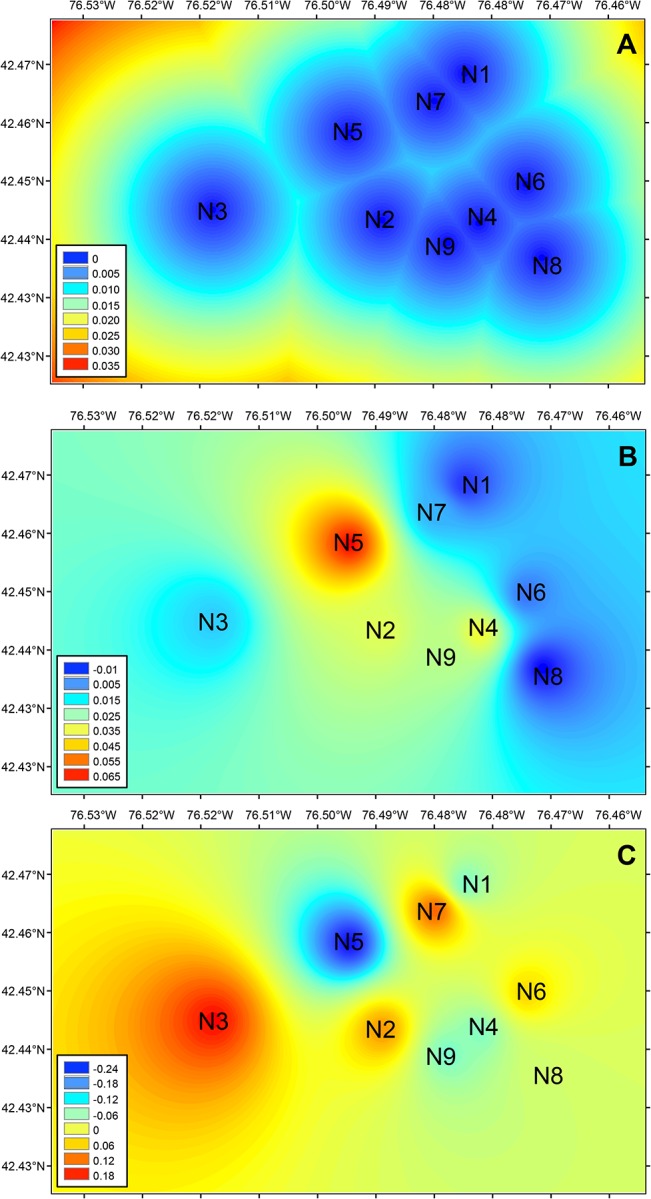
Fig 6. Spatial representation of interpolated landscape genetics metrics for Colletes inaequalis across Ithaca (NY, USA).

Inverse distance weighting of (A) Euclidean distance alone, (B) inbreeding coefficient (F IS), and (C) spatial principal components (sPCA) between nest aggregations. Similar colors represent the similarity of individuals in the landscape based on the three different parameters measured. The genetic landscape of C. inaequalis in the Ithaca study area is not only explained by geographic distance among nests. Nest aggregation N3 is the most geographically isolated, but N5 exhibits the highest inbreeding coefficient (B) and, correspondingly, is the most genetically different (C).
