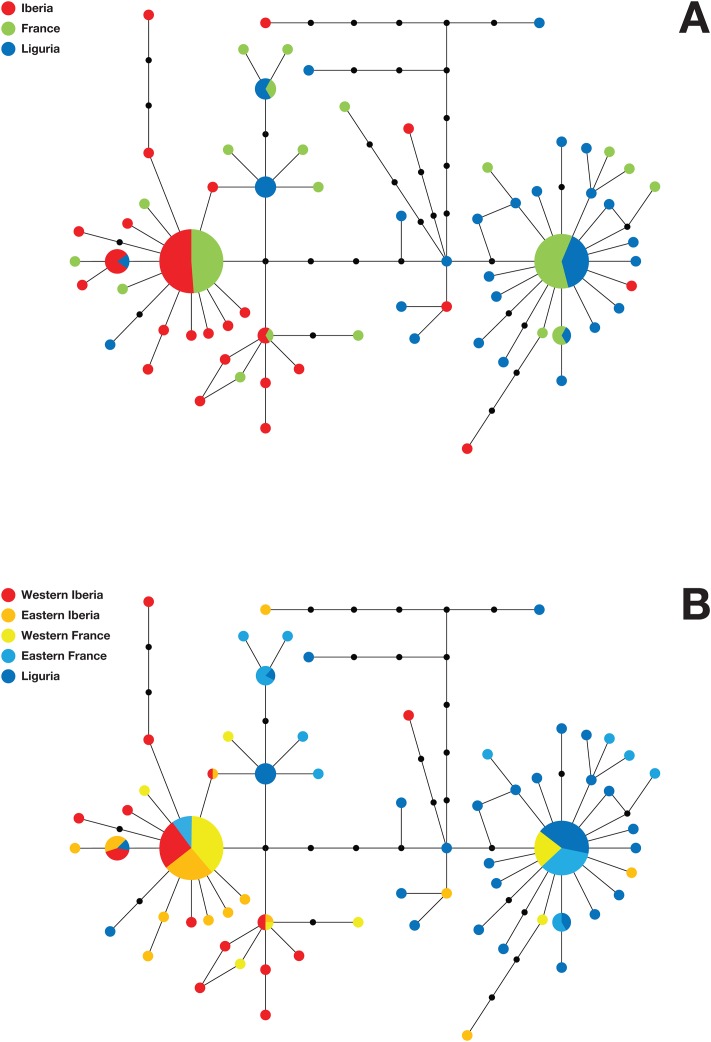
Fig 3. Geographic structure of olive fly population transition between Northwestern Italy and Western Iberia.
Median-joining phylogenetic networks comparing B. oleae mtDNA haplotype distributions in Iberia, France and Liguria. A) Iberia (red), France (green), and Liguria (blue); B) Western Iberia (red), Eastern Iberia (orange), Western France (yellow), Eastern France (light Blue), and Liguria (blue). Circles represent haplotypes, black circles represent unobserved intermediate haplotypes, the length of the connections is proportional to the number of mutational steps that separate the haplotypes, and the size of the circles is proportional to the frequency of the haplotype.

