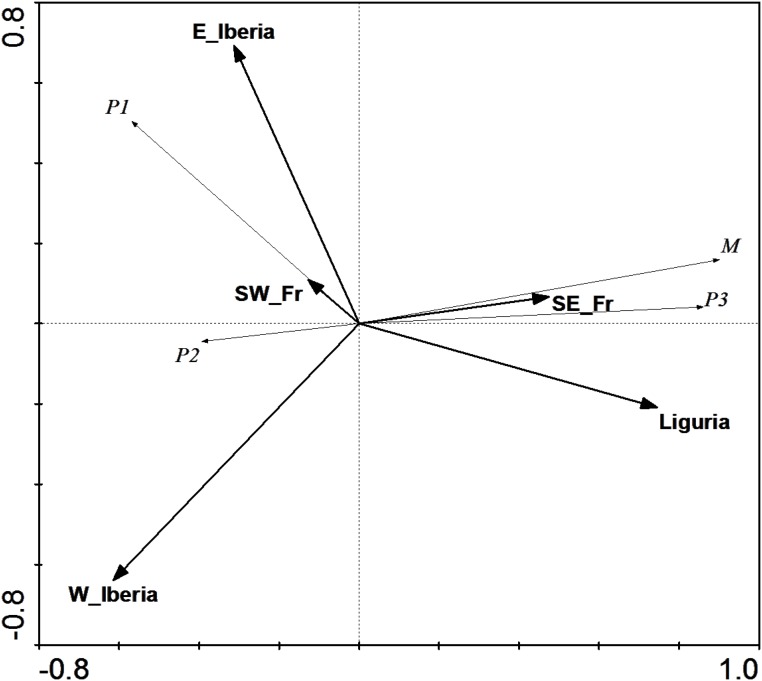
Fig 4. Redundancy analysis (RDA) with sampling regions as explanatory variables.
RDA of olive fly mitochondrial haplotype distributions using lineage frequencies as response variables and sampling regions as explanatory variables. These explained 68.4% of the lineage distribution variability (Monte Carlo test, P<0.005). W_Iberia—Western Iberia; E_Iberia—Eastern Iberia; SW_Fr—Southwestern France; SE_Fr—Southeastern France.

