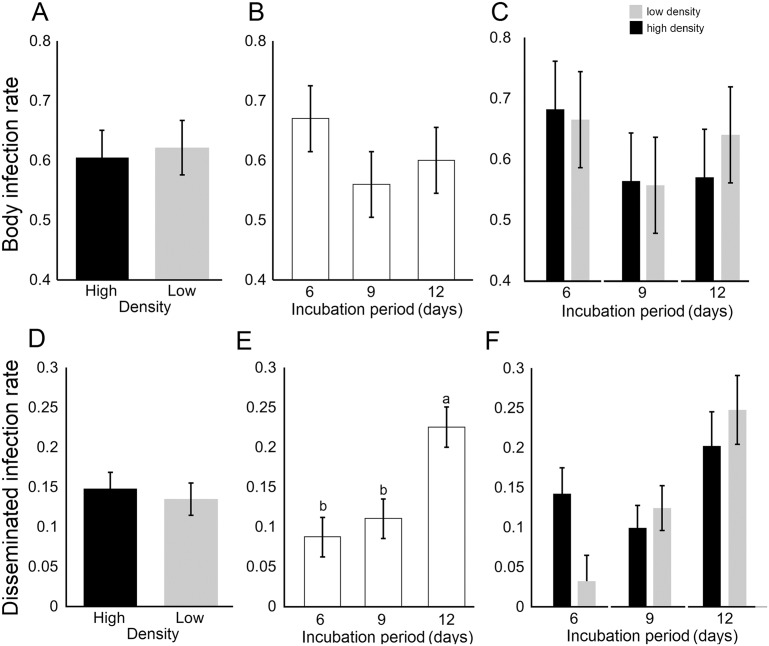
Fig 2. Ae. albopictus body and disseminated leg infection rates.
Panel A-C shows the body infection rate by larval density, incubation period, and larval density by incubation period respectively. Panel D-F shows the disseminated infection rate by larval density, incubation period and larval density by incubation period. Bars above and below the means represent the standard errors of the mean. For each panel, estimates with a different letter are significantly different at P = 0.05, after controlling for multiple comparisons using the Tukey-Kramer adjustment.

