
Fig. 3.
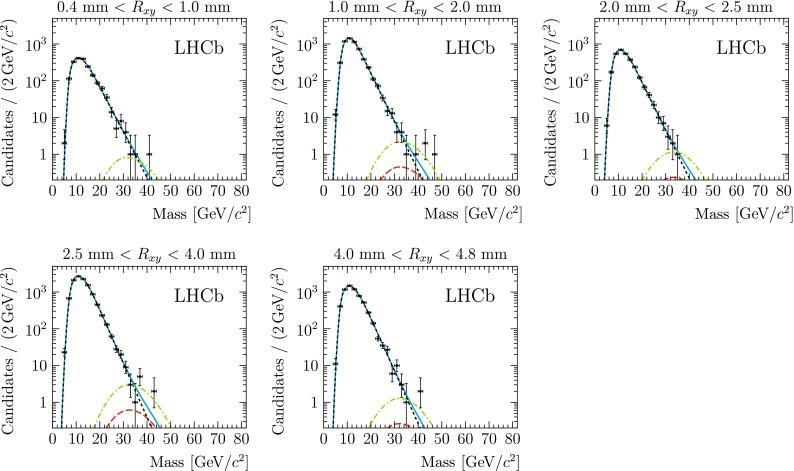
Di-jet invariant mass distributions for each of the five bins, superimposed with the fits for a hidden valley model with and . The blue line indicates the result of the total fit to the data. The black short-dashed line is the background-only contribution, and the red long-dashed line is the fitted signal contribution. For illustration, the green dash-dotted line shows the signal scaled to a cross-section of 17 pb, which corresponds to the SM Higgs production cross-section at 7 TeV [35]