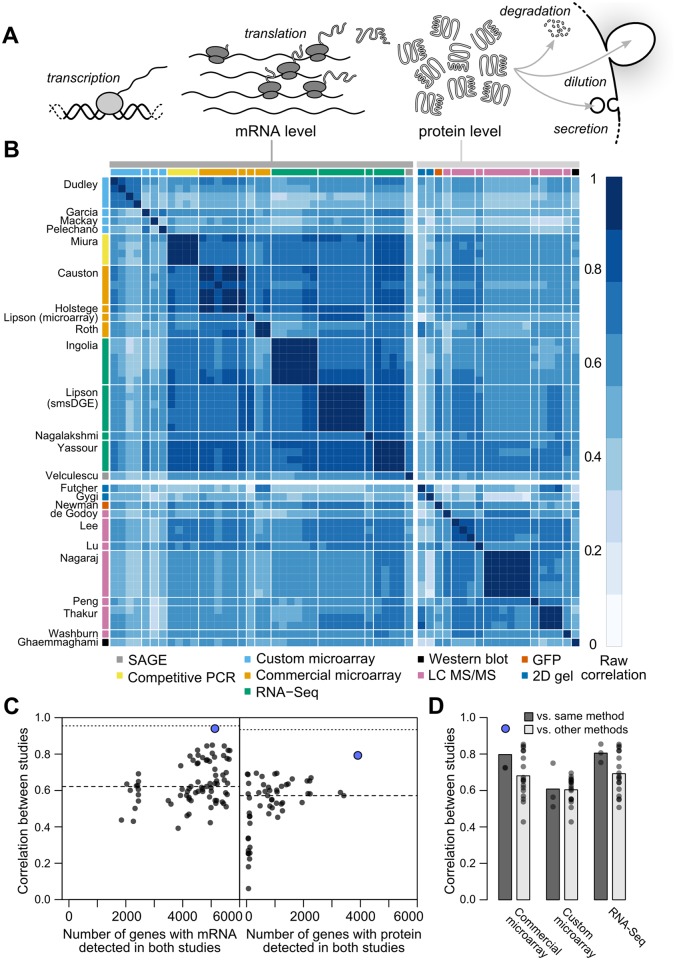
Fig 1. Measurements of steady-state mRNA and protein levels in budding yeast reveal wide variation in reproducibility and coverage.
A, Steady-state protein levels reflect the balance of mRNA translation and protein removal. B, Raw correlations between measurements of mRNA and protein arranged by study (denoted by the first author) with the quantification method indicated. C, Measurements vary widely in reproducibility and coverage. Each point represents a pair of studies. Dots show between-study correlations (median shown by dashed line), a measure of reliability. Dotted line, median of within-study correlations. Blue dots show pairs of studies from the same research group. D, Correlations between studies sharing the same quantification method or different methods (dark and light gray bars, respectively), using mRNA datasets with ≥ 5000 genes (4,595 genes quantified by all datasets). For example, the second column from the left shows the 18 correlations between each of three commercial microarray studies and six studies using custom microarrays or RNA-Seq.

