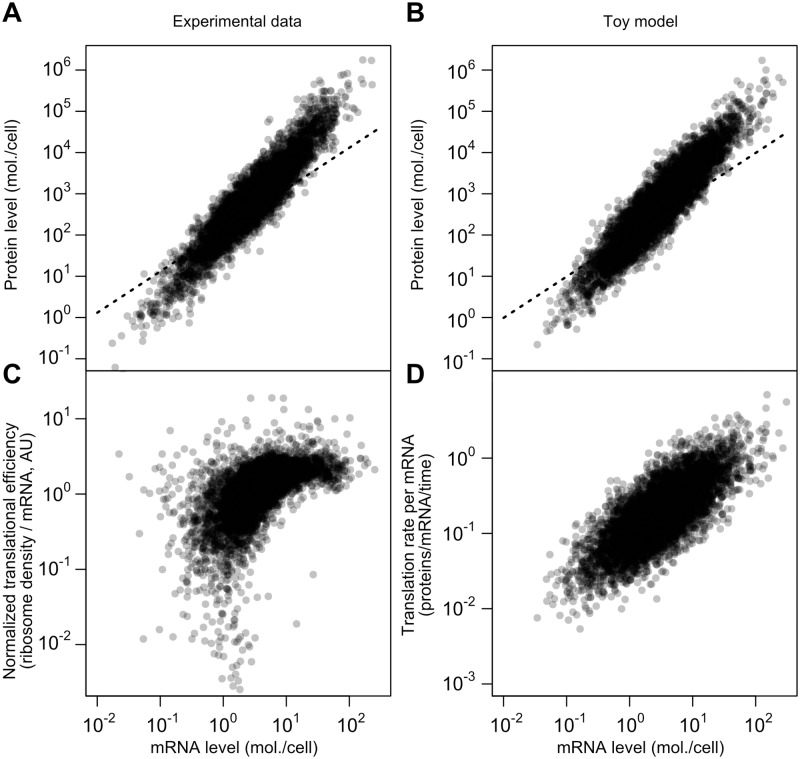
Fig 7. A simplified model captures major features of the steady-state mRNA–protein relationship.
A, mRNA and protein levels estimated by the structured covariance model (cf. Fig 5B). Dotted line shows a linear relationship. B, mRNA and protein levels generated according to a toy model (see text and Methods). Dotted line shows a linear relationship. C, Normalized translational efficiency (ribosome density per mRNA) compared to steady-state mRNA levels. D, Translation rate per mRNA versus mRNA level in the toy model.

