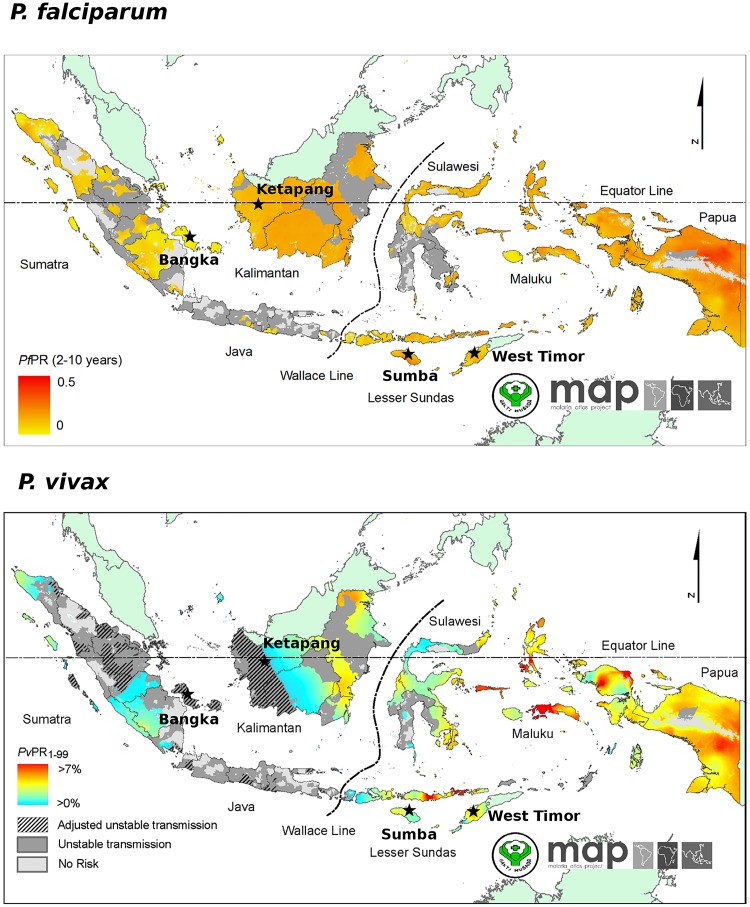
Fig 1. Prevalence maps.
These maps were generated by the Malaria Atlas Project, University of Oxford. The colour scales reflect the model-based geostatistical point estimates of the annual mean P. falciparum parasite rate in the 2–10 year age group (PfPR2–10) (top) [45] and P. vivax parasite rate in the 1–99 year age range (PvPR1–99) (bottom) [46] within the stable spatial limits of transmission in 2010. The approximate locations of the study sites described here are indicated with black stars.

