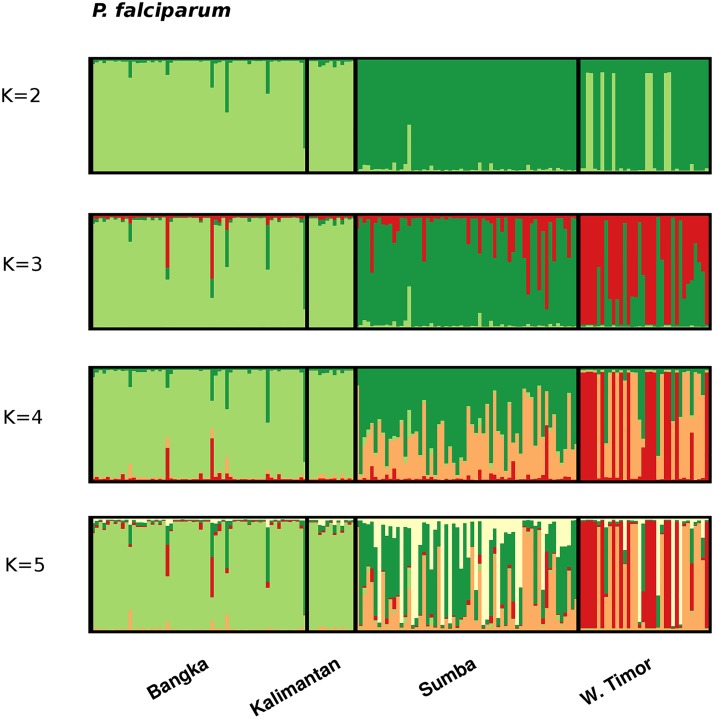
Fig 2. Population structure in P falciparum.
Bar plots illustrating the population structure at K = 2–5 in P. falciparum. Each vertical bar represents an individual sample and each colour represents one of the K clusters (sub-populations) defined by STRUCTURE. For each sample, the predicted ancestry to each of the K sub-populations is represented by the colour-coded bars. K1 = light green, K2 = dark green, K3 = red, K4 = orange, and K5 = white.

