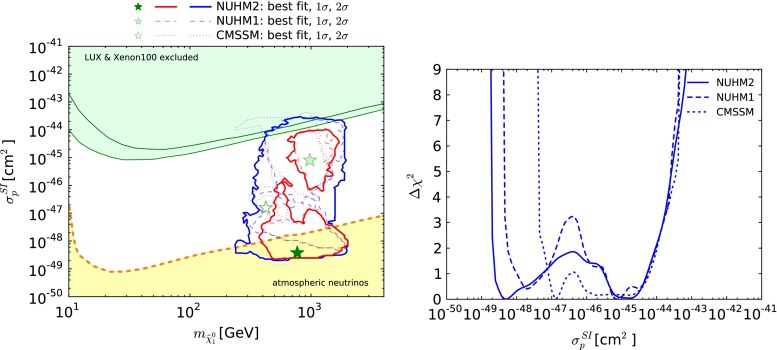
Fig. 13.
Left panel The plane in the NUHM2, with results in the CMSSM and NUHM1 shown for comparison. The star and contours have the same significations as in Fig. 1. Also shown are the 90 % CL upper limits on from the XENON100 [83] and LUX [84] experiments (green and black lines, respectively), and the calculated atmospheric neutrino background level from [169] (orange dashed line). Right panel The functions for in the CMSSM, NUHM1 and NUHM2

