
Fig 4. Unaltered basal levels of autophagy marker LC3 in human skin sections from young and old donors.
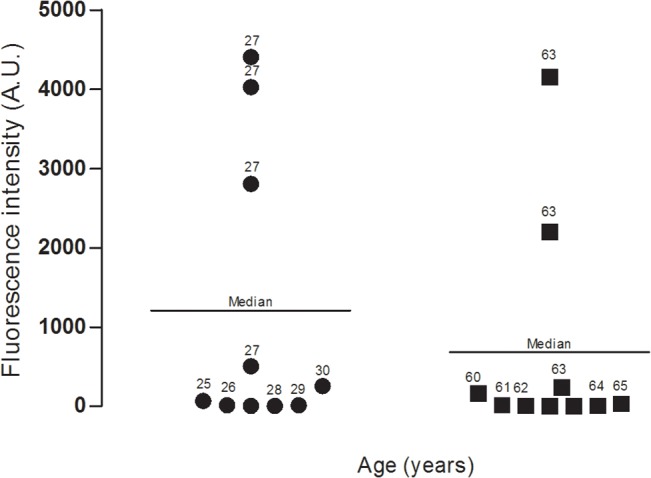
Data represent combined fluorescence levels (arbitrary units) in the skin sections from 10 young and 10 old donors; at least 5 microscopic pictures from each donor were analyzed in this data set. Median value is represented by a line (p = 0.418).