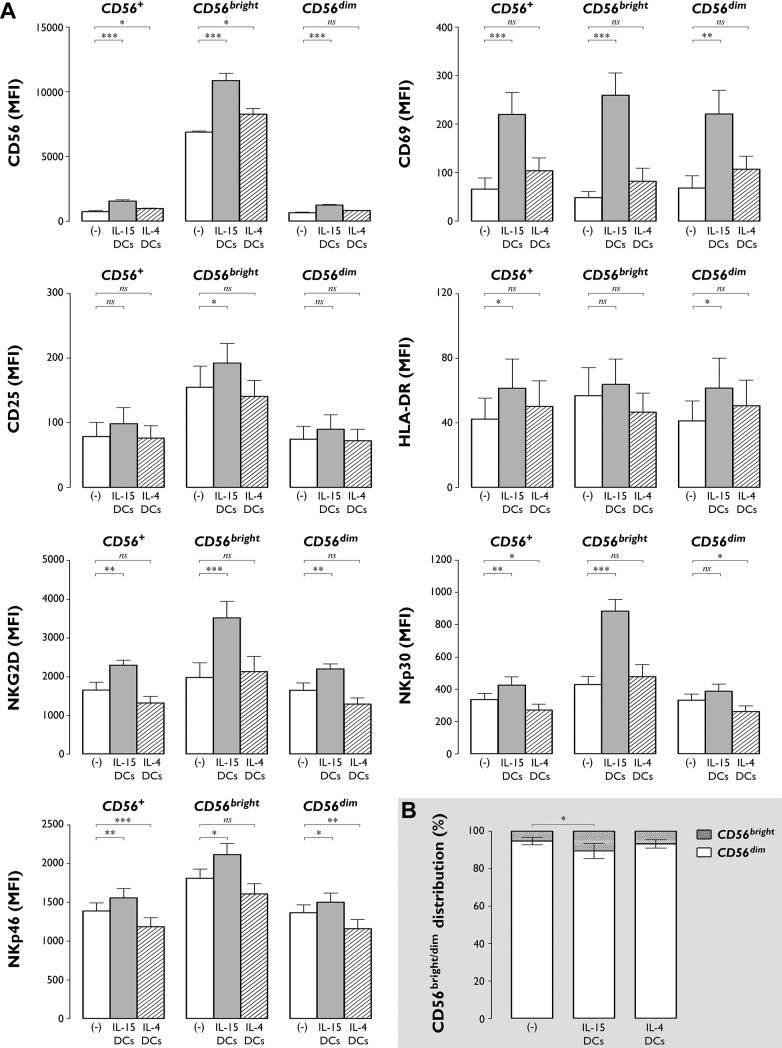
Fig 1. IL-15 DCs induce an activated cytotoxic effector phenotype in NK cells and enlarge the proportion of the CD56bright NK cell subset.
(A) Bar graphs showing the MFI (± SEM) of CD56, CD69, CD25, HLA-DR, NKG2D, NKp30 and NKp46 on unstimulated NK cells ((-), white bars) and NK cells stimulated for 48 hr with autologous IL-15 DCs (grey bars) or IL-4 DCs (dashed bars). Expression levels of the indicated markers are shown for the total CD56+ NK cell population, as well as for the CD56bright and CD56dim NK cell subpopulations. Data are from one experiment with 6 different donors (*, P<0.05; **, P< 0.01; ***, P<0.001; ns, not significant). (B) Bar graphs showing the relative distribution of CD56bright and CD56dim subsets in unstimulated NK cells ((-)) and in NK cells cultured for 48 hr with IL-15 DCs or IL-4 DCs. Data are expressed as mean (± SEM) percentages of 6 donors from 1 experiment (*, P<0.05).

