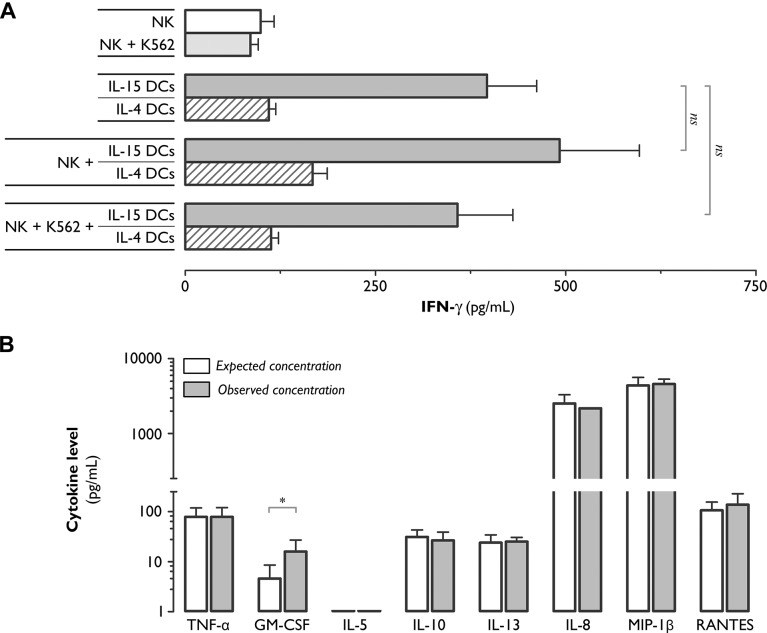
Fig 2. With the exception of GM-CSF, exposure of NK cells to IL-15 DCs does not trigger cytokine or chemokine secretion.
(A) Bar graphs showing the IFN-γ secretion level (pg/mL), as determined by ELISA, in 48-hr culture supernatants collected from NK cell monocultures, IL-15 DC/IL-4 DC monocultures, and NK+IL-15 DC/IL-4 DC co-cultures. Where indicated, the effect of an additional 4-hr stimulation with the K562 tumor cell line was examined. Values represent means (± SEM) of triplicate cultures from 6 individual donors (ns, not significant). (B) Cytokine/chemokine levels (pg/mL; log scale) in 48-hr IL-15 DC-stimulated NK cell culture supernatants, as measured by ECLIA. Observed concentrations (grey bars) were compared with the expected concentrations (white bars) calculated as the sum of the DC and NK cell monoculture concentrations. Values represent means (± SEM) of duplicate measurements of 3 separate donors (*, P<0.05; Wilcoxon matched pairs).

