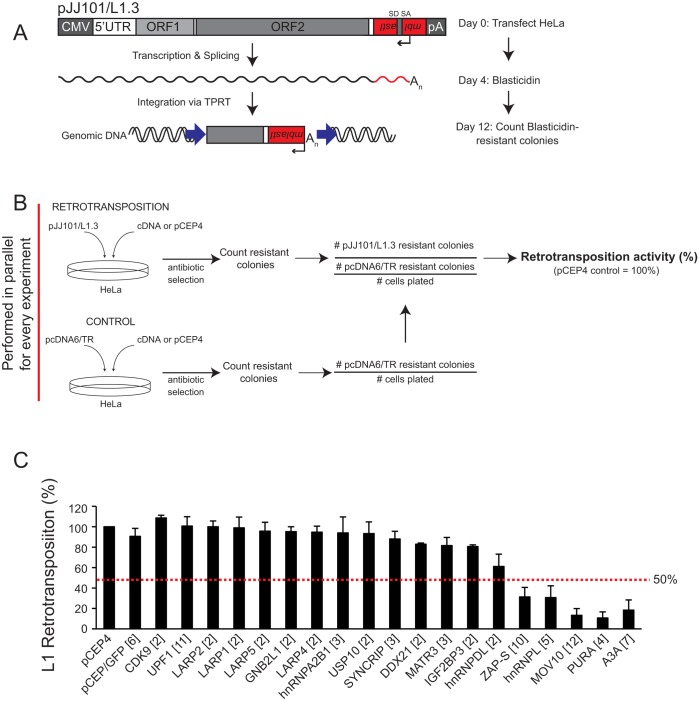
Fig 2. Several of the ORF1p-FLAG interacting proteins inhibit L1 retrotransposition.
(A) Schematic of the cultured-cell retrotransposition assay: HeLa cells were transfected with an engineered human L1.3 construct (pJJ101/L1.3) marked with a blasticidin indicator cassette (mblastI). The pJJ101/L1.3 construct was cloned into a pCEP4 mammalian expression vector. A CMV promoter augments L1 expression and an SV40 polyadenylation signal (pA) is located downstream of the native L1 polyadenylation signal. The mblastI cassette is cloned into the L1 3' UTR antisense to the L1 and contains a blasticidin deaminase gene that is disrupted by an intron in the L1 sense orientation. The blasticidin deaminase gene can only be expressed when the L1 transcript is spliced, reverse transcribed, and inserted into genomic DNA [30,71]. (B) Schematic of the pJJ101/L1.3 retrotransposition screen: To analyze the effect of the ORF1p-FLAG interacting proteins on L1 retrotransposition, HeLa cells were co-transfected with equal amounts of pJJ101/L1.3 and a cDNA plasmid expressing one of the candidate ORF1p-FLAG interacting proteins or a pCEP4 empty vector. To control for potential off-target effects, HeLa cells also were co-transfected with a control plasmid (pcDNA6/TR) that expresses the blasticidin deaminase gene and a cDNA plasmid expressing one of the candidate proteins or a pCEP4 empty vector. Both assays were subjected to the same blasticidin selection regimen. The resultant number of blasticidin-resistant colonies in pcDNA6/TR control assays provides a visual, quantitative readout of the effect of cDNA overexpression on the ability of cells to grow in the presence of blasticidin. (C) Results of pJJ101/L1.3 retrotransposition screen: HeLa cells were co-transfected with pJJ101/L1.3 and each of the indicated cDNA expressing plasmids. L1 retrotransposition was assayed in 6-well tissue culture plates. The X-axis indicates the cDNA that was co-transfected with pJJ101/L1.3. The bracketed number next to each cDNA indicates the number of independent experiments. The Y-axis indicates L1 retrotransposition activity after accounting for cDNA toxicity (see Fig 2B). Retrotransposition activity (black bars) is normalized to the pCEP4 empty vector control. Error bars represent the standard deviation for each set of experiments. The red dotted line indicates a 50% inhibition of retrotransposition activity.

