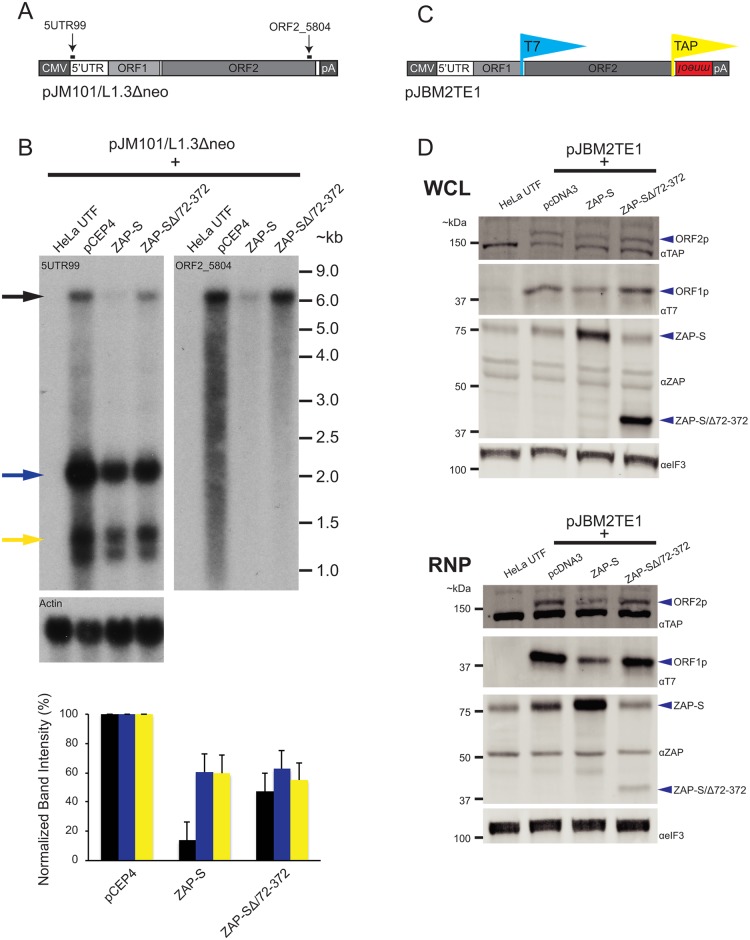
Fig 4. The effect of ZAP-S on L1 RNA and L1 protein expression.
(A) Schematic of pJM101/L1.3Δneo: Bold black lines indicate the approximate location of probes (5UTR99 and ORF2_5804) used in the northern blot experiments. pJM101/L1.3Δneo is expressed from a pCEP4 vector. A CMV promoter augments L1 expression and an SV40 polyadenylation signal (pA) is located downstream of the native L1 polyadenylation signal. (B) Results of northern blots: Top panel: HeLa cells were co-transfected with pJM101/L1.3Δneo and either the indicated ZAP-S expression plasmids or an empty pCEP4 vector. Northern blot images depict the effect of ZAP-S overexpression on polyadenylated L1 RNA levels. The constructs transfected into HeLa cells are indicated above each lane. UTF indicates untransfected HeLa cells and serves as a negative control. Probes (5UTR99 and ORF2_5804) are indicated in the top left corner of the respective blots. The black arrow indicates the position of the full-length L1 RNA. The blue and yellow arrows indicate shorter L1 RNA species. The experiment was repeated three times with similar results. Actin served as a loading control. RNA size standards (~kb) are shown at the right of the blot image. Bottom panel: Quantification of northern blot bands. The X-axis indicates the cDNA expression construct that was co-transfected with pJM101/L1.3Δneo. The Y-axis indicates relative band intensity normalized to pCEP4 controls (100%). Black bars represent the full-length L1 band. Blue and yellow bars represent the smaller L1 RNA bands, corresponding to the colored arrows, respectively, in the top panel. The results are the average of three independent experiments. Error bars represent standard deviations. (C) Schematic of pJBM2TE1: The construct contains a T7 epitope tag on the carboxyl-terminus of ORF1p and a TAP tag on the carboxyl-terminus of ORF2p. An mneoI retrotransposition indicator cassette is present in the 3’ UTR. pJMB2TE1 is expressed from a pCEP4 backbone, which has been modified to contain a puromycin selectable marker. A CMV promoter augments L1 expression and an SV40 polyadenylation signal (pA) is located downstream of the native L1 polyadenylation signal. (D) ZAP-S decreases the accumulation of the L1-encoded proteins: HeLa cells were co-transfected with pJBM2TE1 and the plasmids indicated above each lane. UTF indicates untransfected HeLa cells and serves as a negative control. Depicted are western blots using whole cell lysates (WCL, top panel) or RNP fractions (RNP, bottom panel). Blue arrows indicate the positions of ORF2p, ORF1p, ZAP-S, and ZAP-S/∆72–372. The eIF3 protein is used as a loading control. Representative images are shown. The experiments were repeated three times with similar results.

