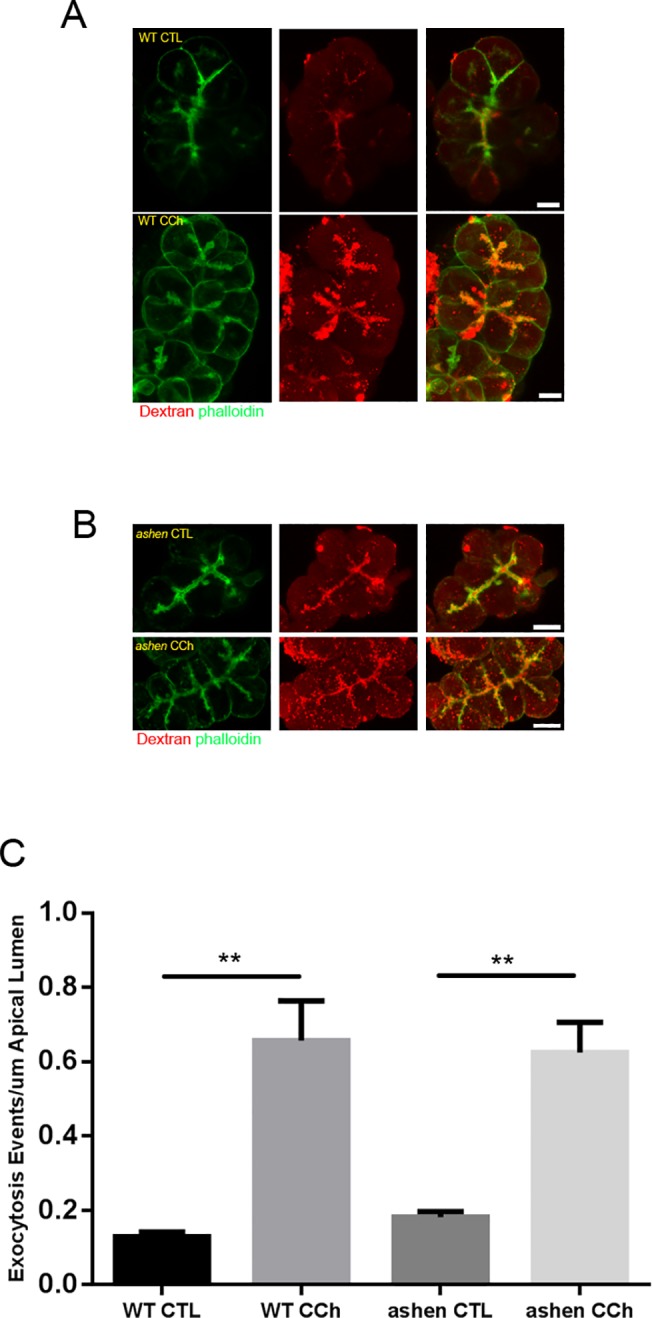
Fig 7. Visualization of zymogen granule secretory pathway by apical lumen marking with Dextran-Texas Red.

(A and B) Freshly made acini were incubated with 1 mg/mL 3000 Da Dextran-Texas Red, stimulated with or without 3 μM carbachol (CCh), fixed and visualized as described in Material and Methods. Confocal microscopy images were obtained with a 60X objective lens. Representative maximum intensity projections of z-stacks images are shown. (C) Quantitative analysis on images obtained from 14 to 22 individual acini from three separate experiments. One WT and one ashen mouse were used in each experiment. Statistical results are mean ± SE. **P < 0.01. Scale bar = 10 μm.
