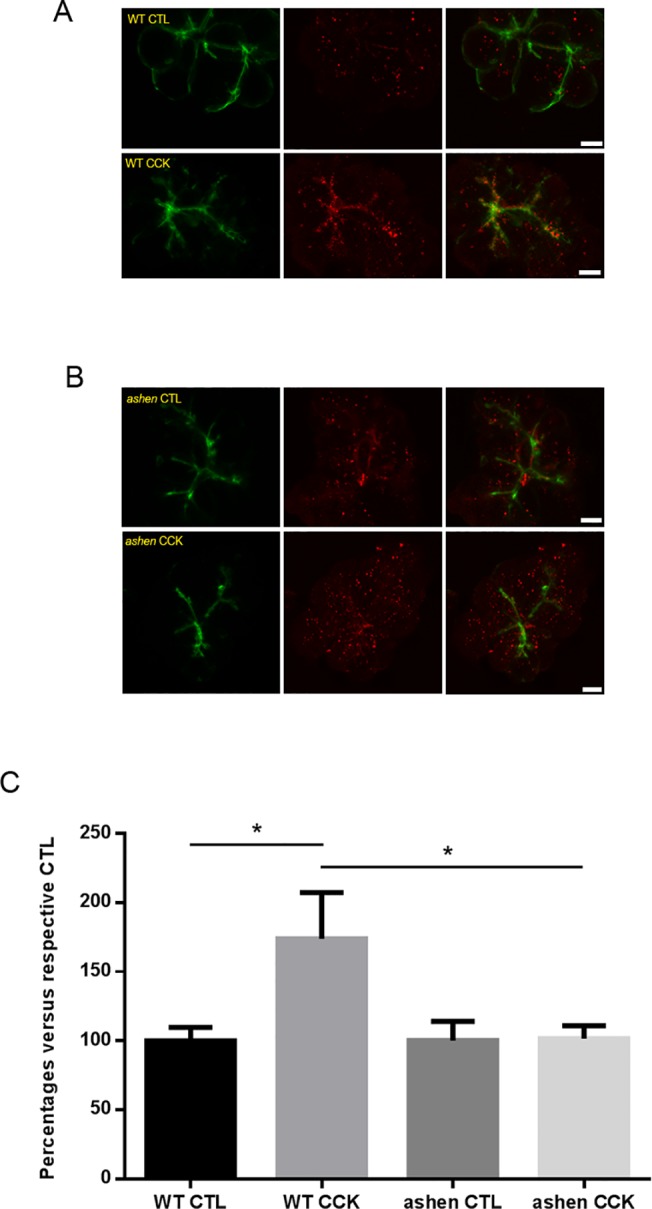
Fig 8. Visualization of minor-regulated secretory pathway by apical cell surface labeling with anti-LAMP1 staining.

(A and B) Freshly made acini were stimulated with 30 pM CCK and processed as described in Material and Methods. Confocal images of LAMP1 staining (red) and actin (phalloidin, green) were obtained. Representative maximum intensity projections of z-stacks images are shown. (C) Quantitative analysis on the images obtained from 14 to 24 individual acini from three separate experiments. One WT and one ashen mouse were used in each experiment. Statistical results are mean ± SE. *P < 0.05. Scale bar = 10 μm.
